
 Risk Management
EA Position Sizing for a Drawdown Lock
A trailing drawdown lock ratchets up with every new equity high and never gives ground back. Most EAs have no idea it exists.
We've pulled the plug on more gold grid EAs than any other instrument class, and it's never the strategy logic that kills the account. It's the spacing.

We've pulled the plug on more gold grid EAs than any other instrument class, and it's never the strategy logic that kills the account. It's the spacing.
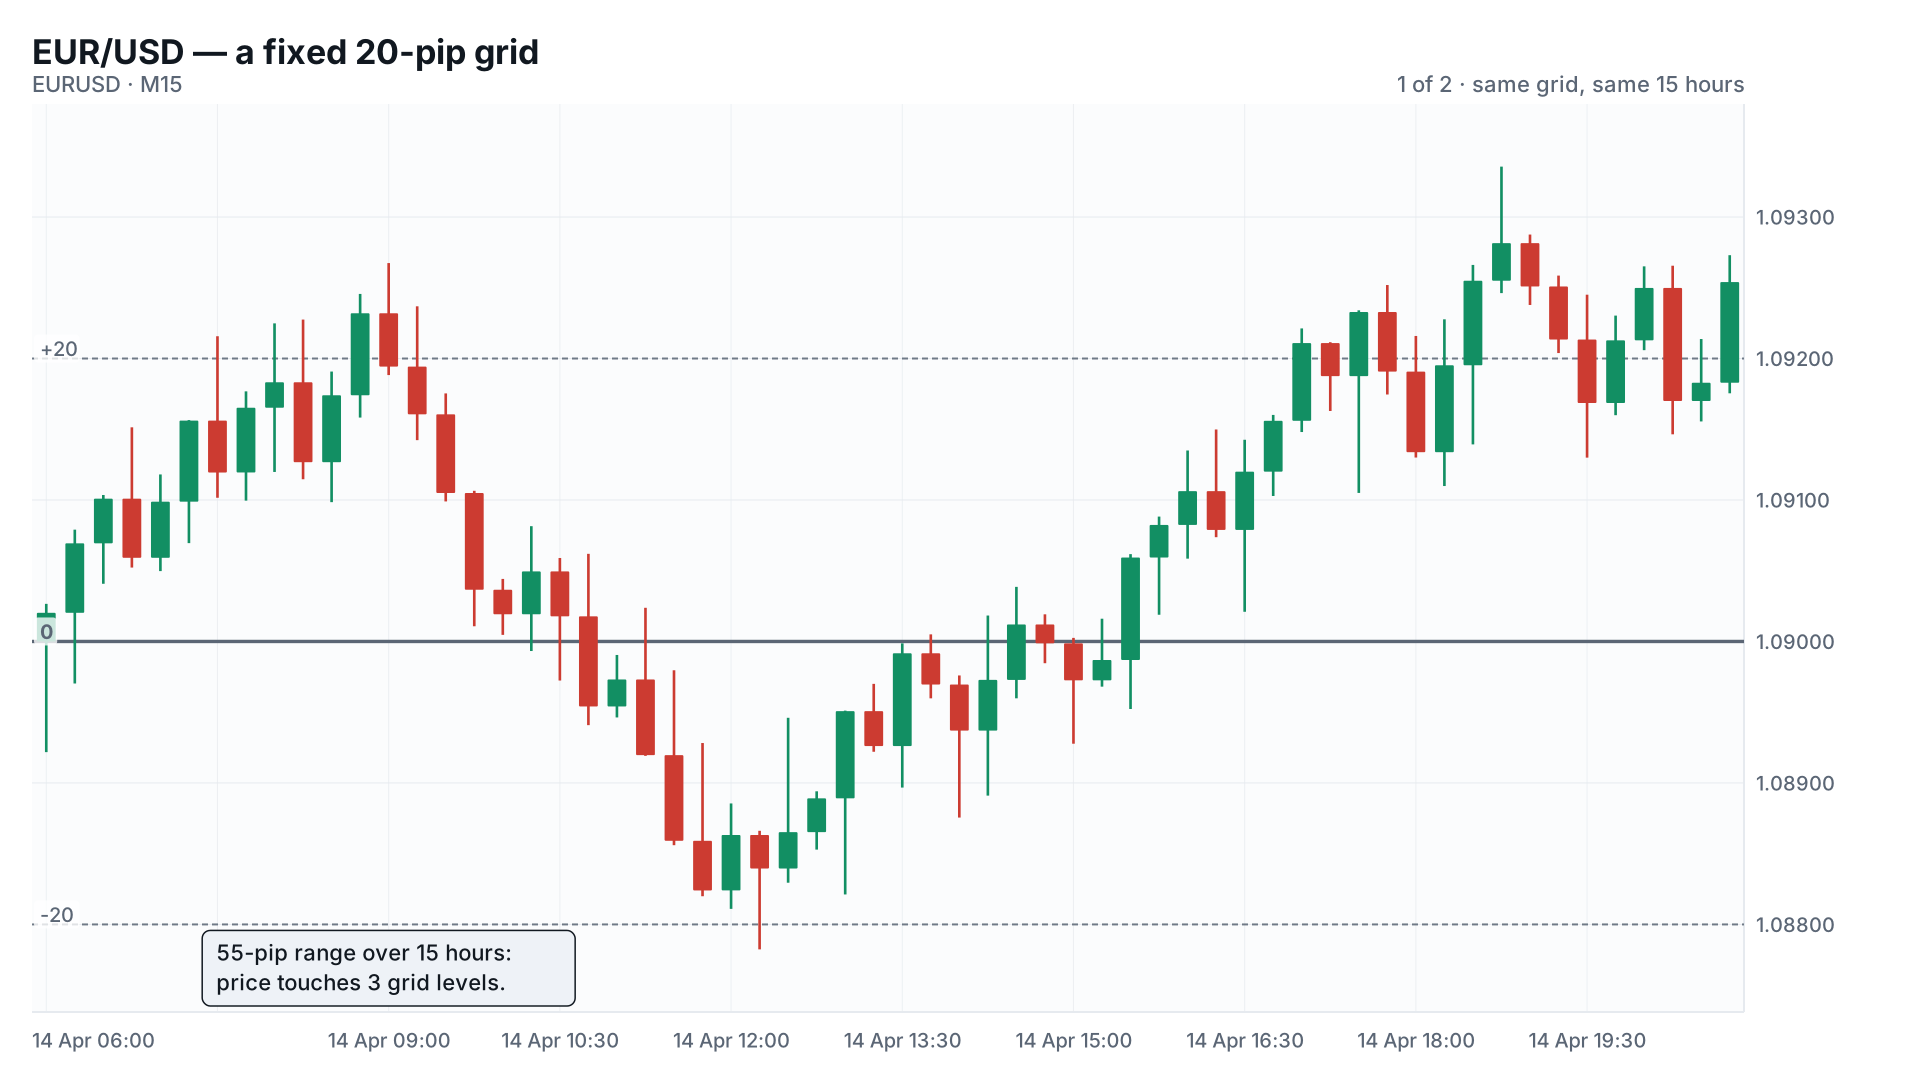
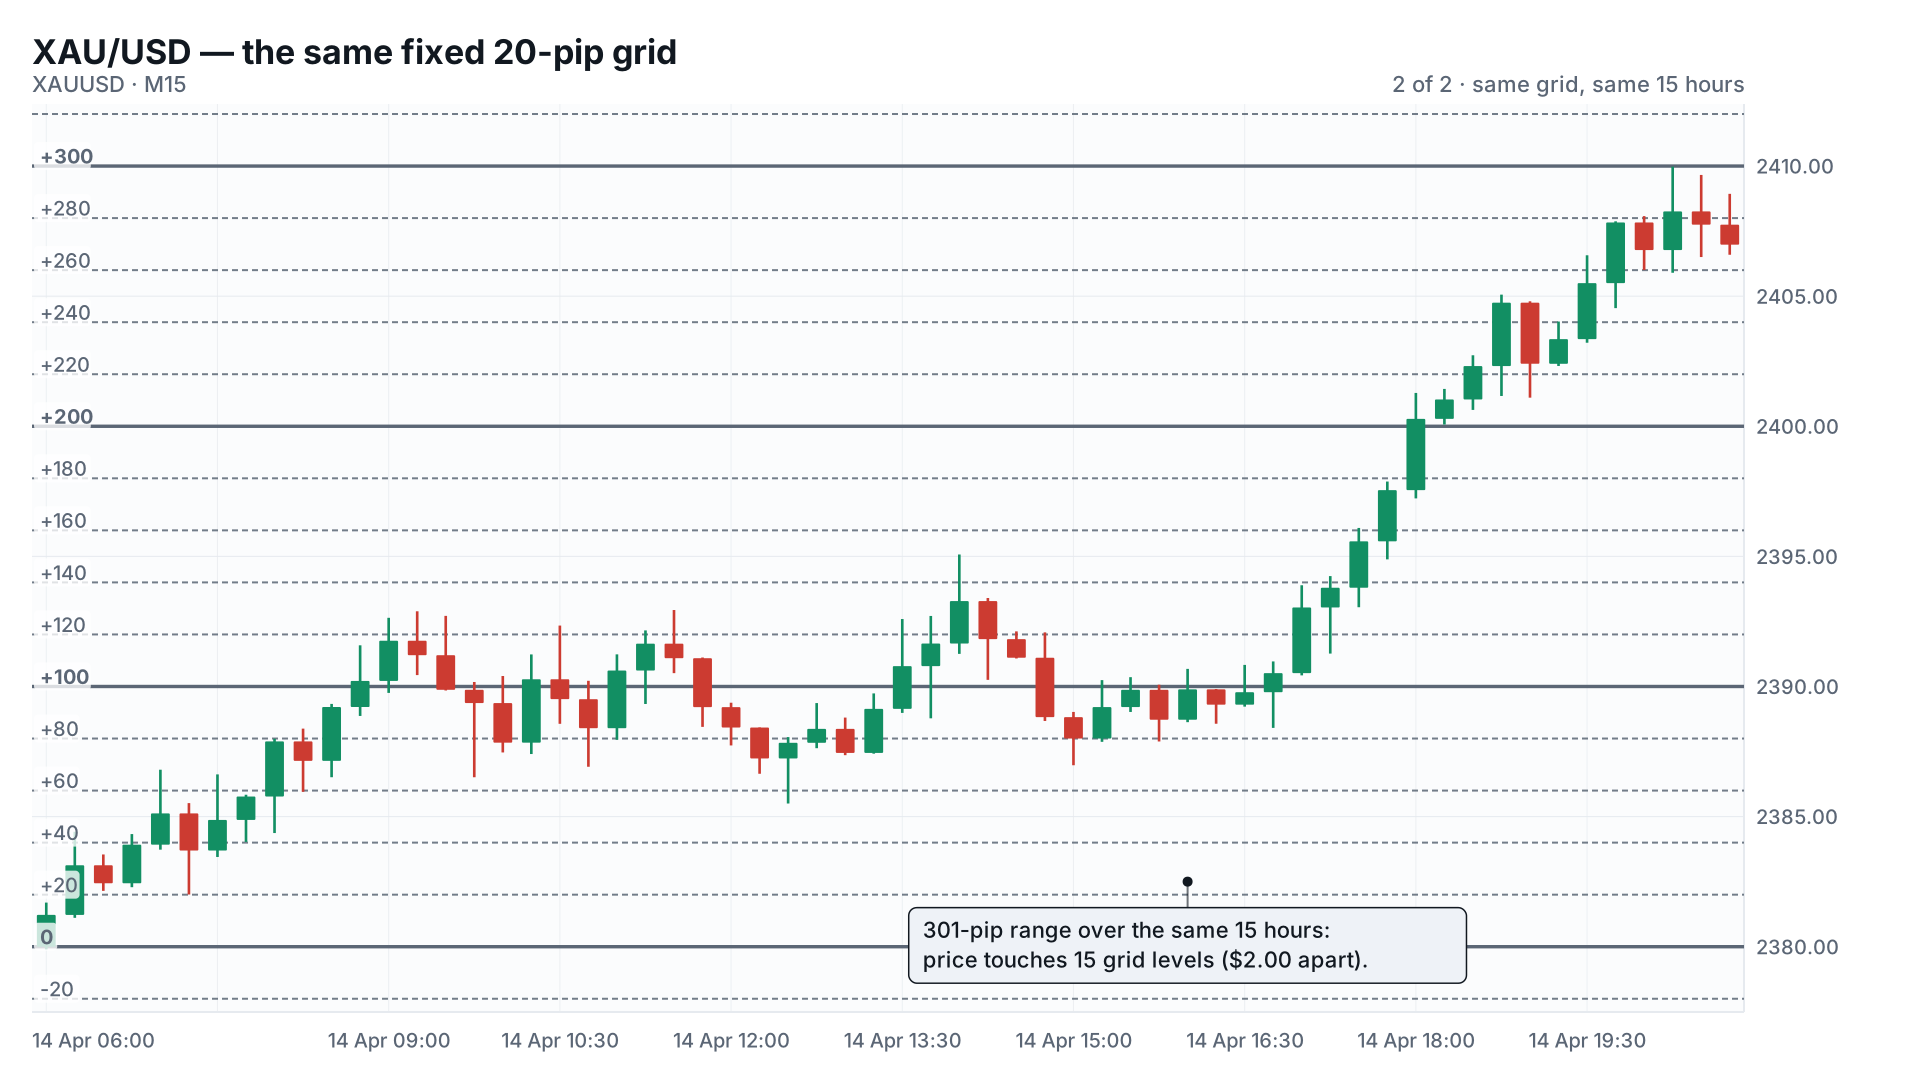
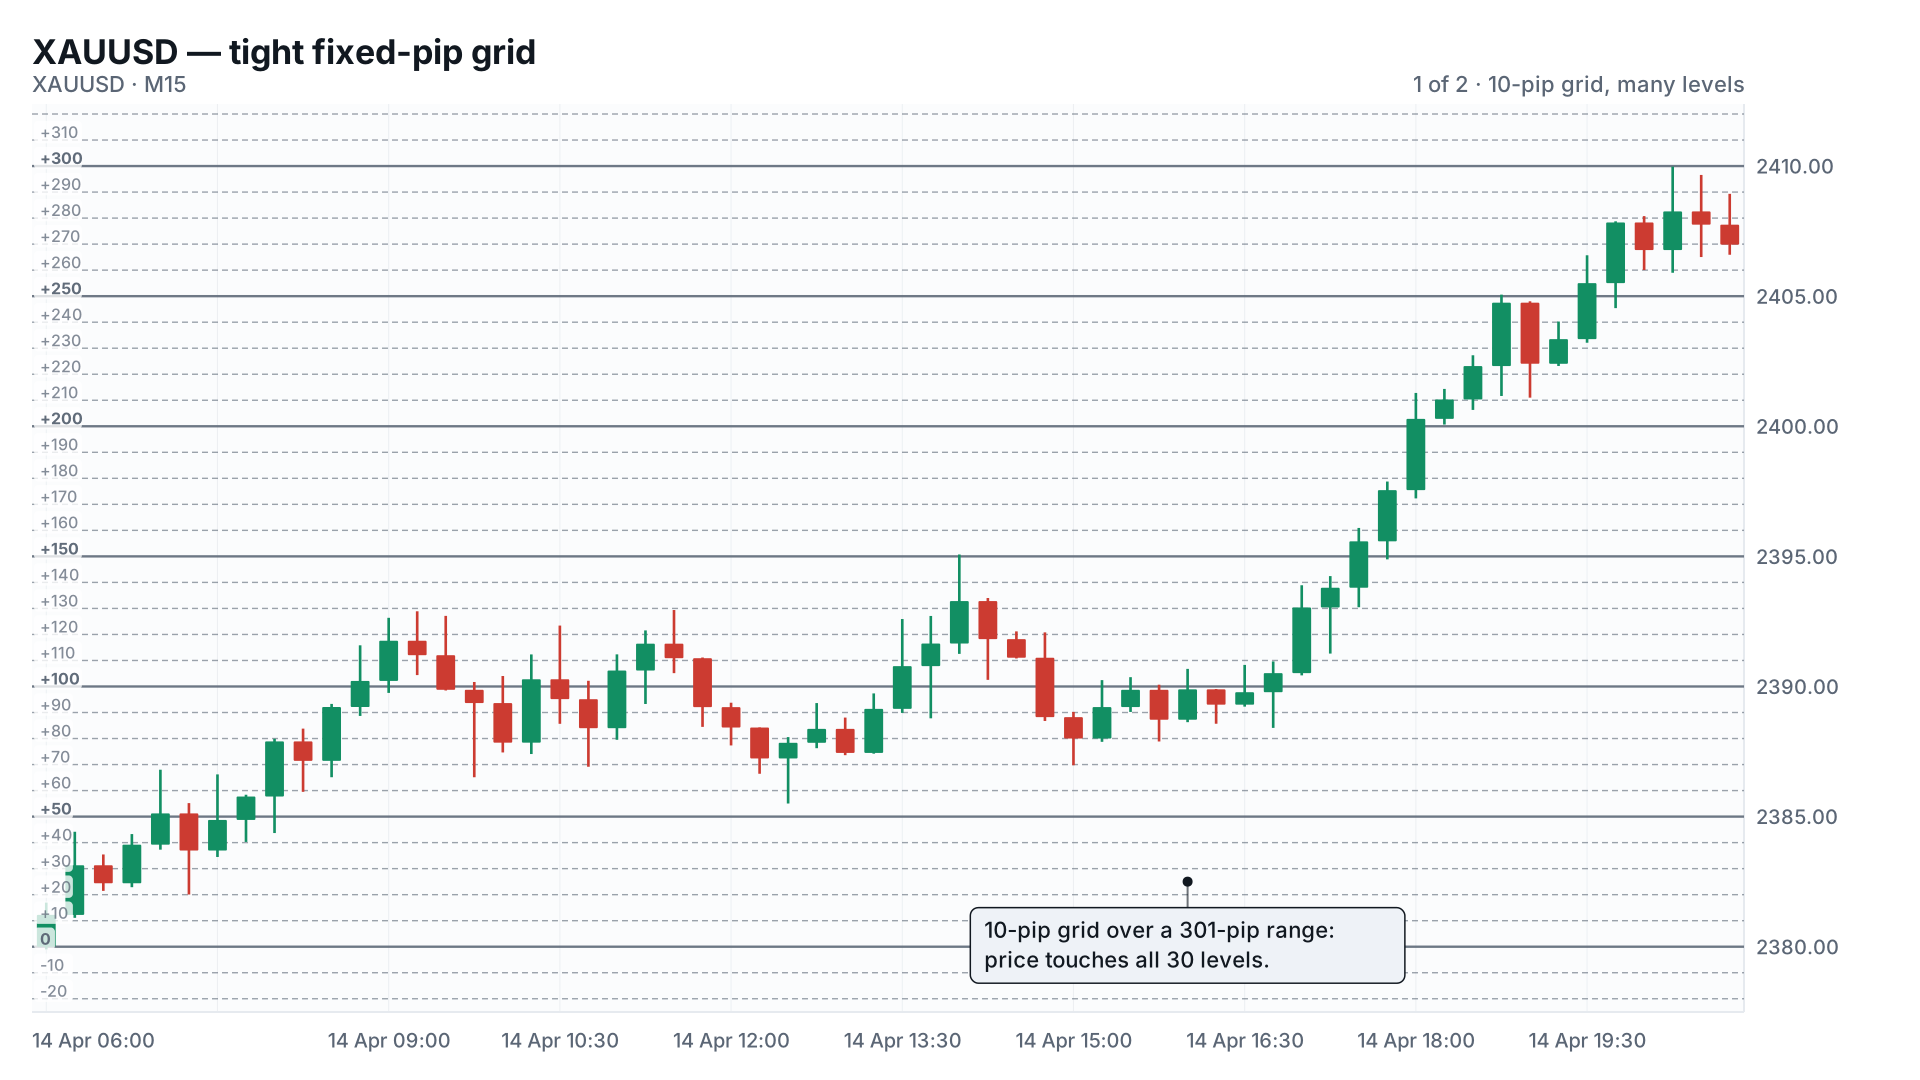
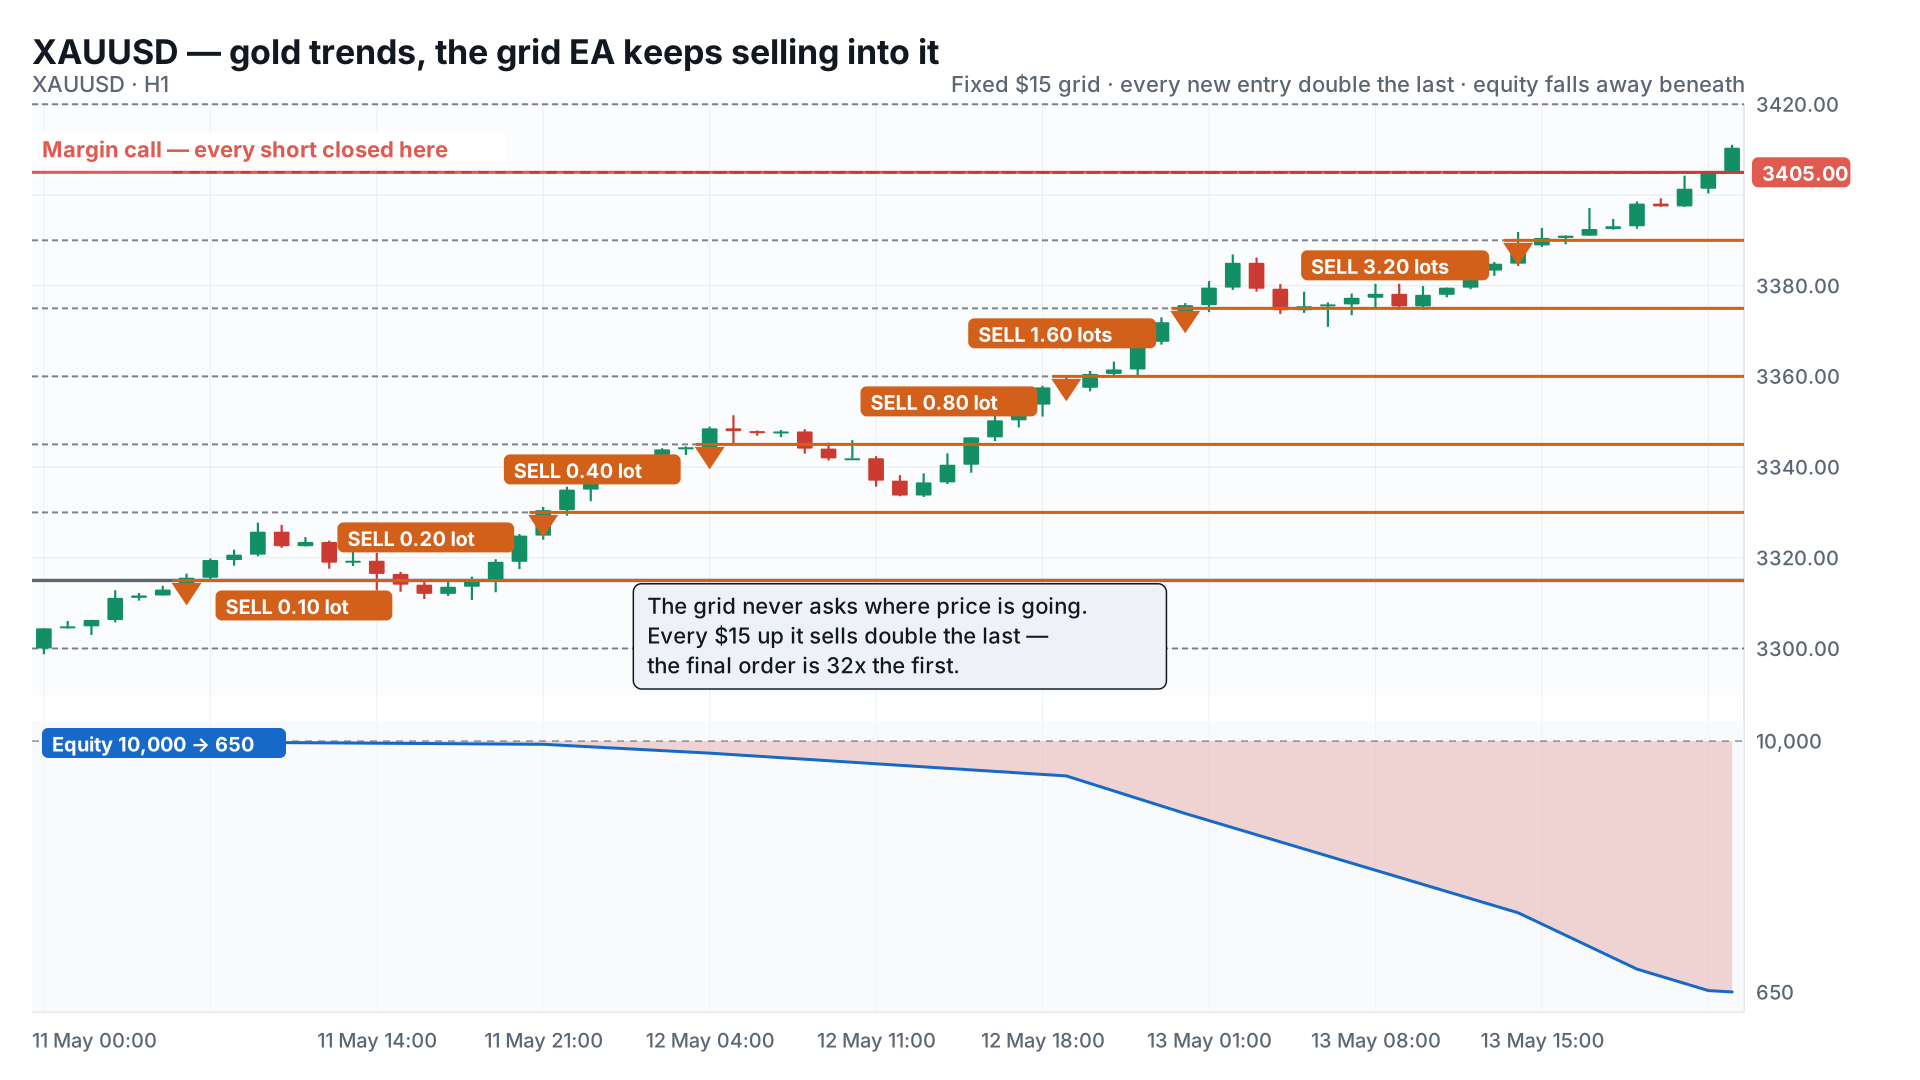
A grid or martingale EA scales lot size (and sometimes basket count) every time price moves against the open position by a fixed number of pips. On EUR/USD, a 20-pip grid step behaves roughly the same during a quiet Tuesday as during NFP week (annoying, but survivable). On XAU/USD, that same fixed-pip logic is measuring a different animal. Gold's average true range on the H1 chart can swing from $3 to $30 across a single week depending on the DXY, real yields, or a random Fed governor's tweet.
Fixed-pip grids don't know that. They keep adding legs at the same spacing regardless of what the market is doing, so the EA that survived six months of low-vol chop can add four grid levels in an afternoon the moment gold trends.
This isn't an argument against grid or martingale systems on gold. It's an argument against running one without an independent circuit breaker that doesn't care what the EA's own logic thinks is "just one more level."
For a broader look at why grid/martingale recovery systems carry a different risk shape than breakout or fixed-risk EAs, see our grid EA vs breakout EA comparison.
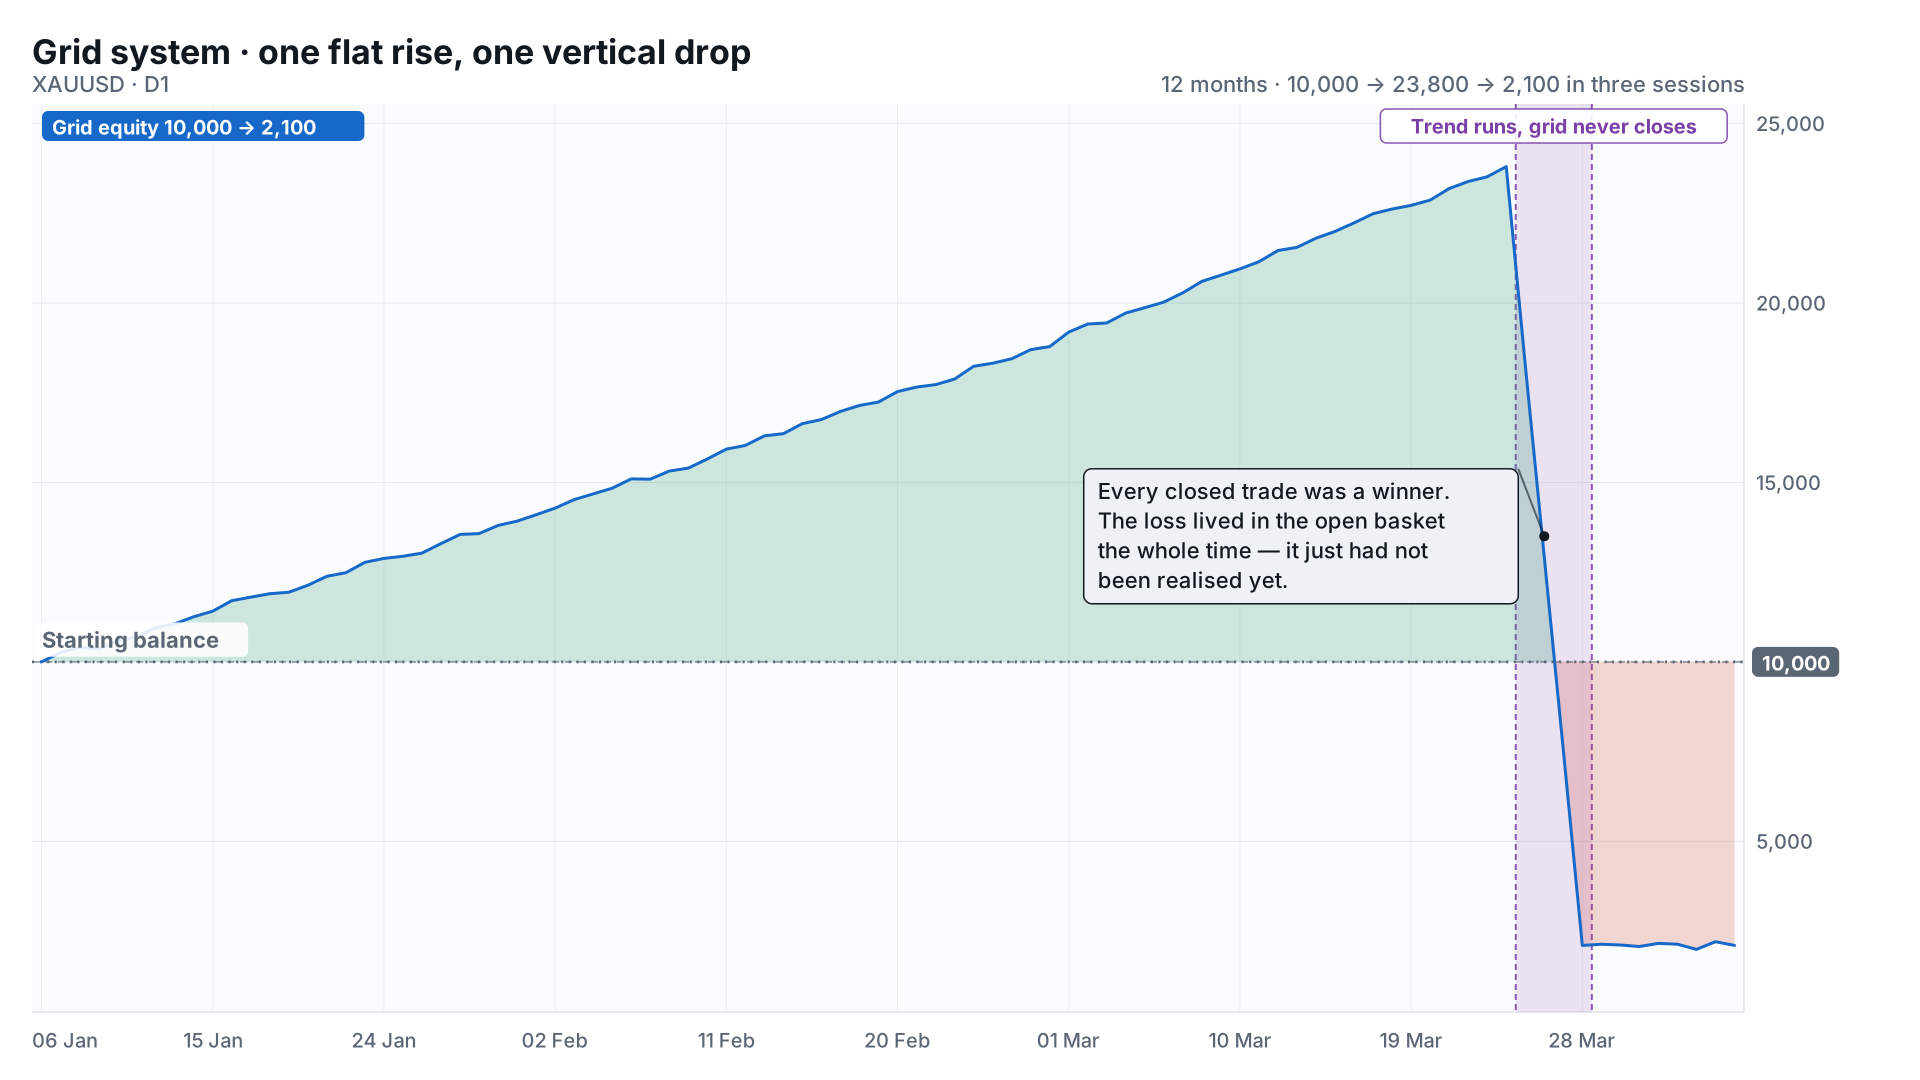
Every grid blow-up we've post-mortemed follows the same shape: price moves against the first entry, the EA opens a second position at a larger lot size, price keeps moving, a third position opens larger still, and floating loss grows geometrically while margin shrinks linearly.
The EA's own logic has no concept of "this has gone too far"; it only knows "add the next level."
That's the mechanical problem the rest of this post solves. Not "should I run martingale on gold" (a risk-appetite question we're not answering for you) but "given that I am running one, where's the kill switch."
The fix is an equity-based drawdown guard: a function that checks floating drawdown as a percentage of account equity on every tick (or every N seconds) and force-closes the entire basket if it breaches a threshold, independent of whatever the grid logic itself is doing.
A reliable equity guard comes down to six concrete steps:
AccountInfoDouble()(balance - equity) / balance * 100MaxDrawdownPercent inputCTrade::PositionClose()input double MaxDrawdownPercent = 20.0; // % of balance — floating DD trigger
input int MagicNumber = 20260721;
CTrade trade;
void CheckEquityGuard()
{
double balance = AccountInfoDouble(ACCOUNT_BALANCE);
double equity = AccountInfoDouble(ACCOUNT_EQUITY);
if(balance <= 0.0) return; // guard against div-by-zero on a flat/new account
double floatingDrawdownPct = (balance - equity) / balance * 100.0;
if(floatingDrawdownPct >= MaxDrawdownPercent)
{
CloseAllBasketPositions();
PrintFormat("Equity guard triggered: floating DD %.2f%% >= limit %.2f%%",
floatingDrawdownPct, MaxDrawdownPercent);
}
}
void CloseAllBasketPositions()
{
for(int i = PositionsTotal() - 1; i >= 0; i--)
{
ulong ticket = PositionGetTicket(i);
if(ticket == 0) continue;
if(PositionGetInteger(POSITION_MAGIC) != MagicNumber) continue;
trade.PositionClose(ticket);
}
}
Two details matter here, and both are where we've seen homemade versions fail.
The loop runs backwards (PositionsTotal() - 1 down to 0). PositionsTotal() re-evaluates on every call, and closing a position shifts the index of everything below it. Loop forward and you'll skip a position every time one closes. We've seen EAs leave one leg of a basket open from exactly this off-by-one.
And balance is the anchor, not equity. Balance only changes on closed trades, so it gives a stable denominator. Anchor to equity instead and the percentage moves as the drawdown itself grows, quietly raising your own trigger threshold mid-event.
Call CheckEquityGuard() on every OnTick() for fast protection, or on an OnTimer() interval (we use 5–15 seconds) to avoid running a percentage calculation on every price change during high-tick-rate gold sessions.
The equity guard is a floor. It stops the bleeding after the fact. Capping the grid itself stops it from getting that bad in the first place.
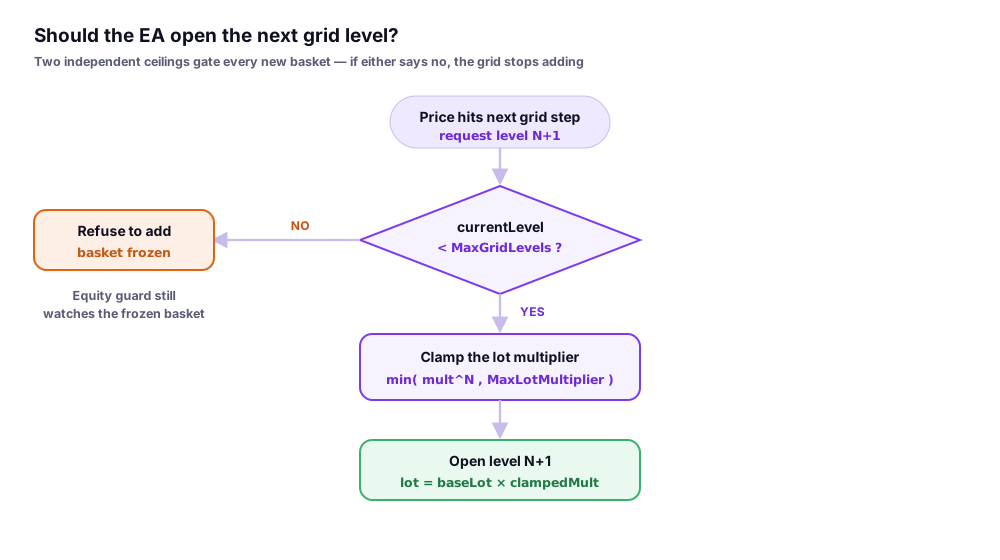
Two levers, and most EAs we've inspected implement neither properly:
input int    MaxGridLevels     = 6;
input double LotMultiplier     = 1.5;
input double MaxLotMultiplier  = 8.0;   // hard ceiling regardless of level count

double GetNextLotSize(int gridLevel, double baseLot)
  {
   double multiplier = MathPow(LotMultiplier, gridLevel);
   multiplier = MathMin(multiplier, MaxLotMultiplier);
   return NormalizeDouble(baseLot * multiplier, 2);
  }

bool CanOpenNextLevel(int currentGridLevel)
  {
   return currentGridLevel < MaxGridLevels;
  }
MathPow(1.5, 6) is roughly 11x your starting lot, survivable on most account sizes. MathPow(1.5, 12) is over 129x. That's the difference between "we widened the stop" and "we margin-called," and it comes from six extra grid levels most traders never bothered to cap.
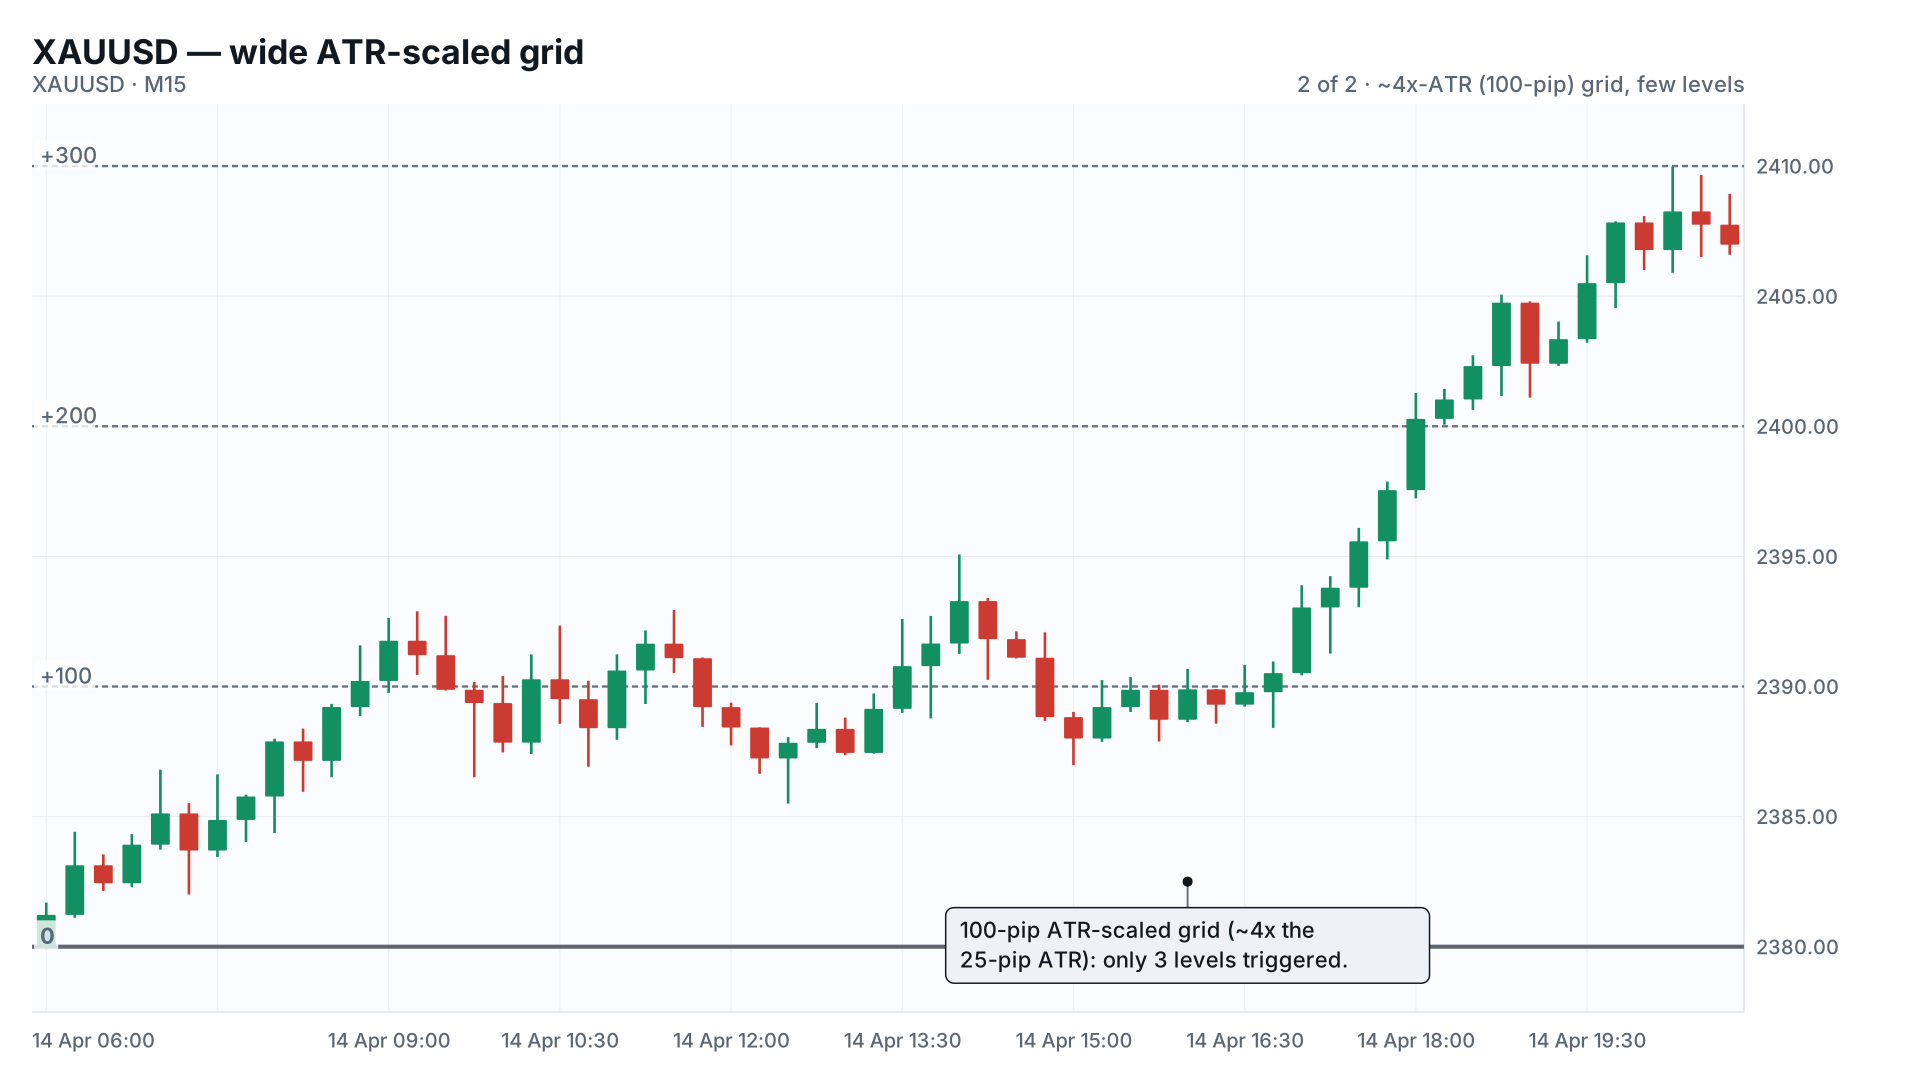
Fixed-pip spacing is the root cause we opened with. The fix is to size the grid step from the instrument's own recent volatility instead of a static number pulled from a EUR/USD backtest.
input int    ATR_Period     = 14;
input double ATR_Multiplier = 1.5;

int atrHandle = INVALID_HANDLE;

int OnInit()
  {
   atrHandle = iATR(_Symbol, PERIOD_H1, ATR_Period);
   return (atrHandle != INVALID_HANDLE) ? INIT_SUCCEEDED : INIT_FAILED;
  }

double GetGridStepPoints()
  {
   double atrBuffer[];
   if(CopyBuffer(atrHandle, 0, 0, 1, atrBuffer) <= 0)
      return 0.0; // fail safe: caller should skip this tick if 0

   double atrValue = atrBuffer[0];
   return atrValue / _Point * ATR_Multiplier;
  }
iATR() returns an indicator handle, not a value. That catches people coming from MQL4, where iATR() returned the value directly. In MQL5 you pull the number via CopyBuffer(), and buffer index 0 here is the ATR line itself. During a quiet Asian session, gold's H1 ATR might sit near $2; during a US CPI print it can spike past $15. A step size derived from that number widens automatically when the market is doing the thing that would have blown up a fixed 200-point grid.
Once the guard exists, the next decision is what window it measures against. This changes trader behaviour, not just code.
| Limit type | Resets | Protects against | Trade-off |
|---|---|---|---|
| Daily drawdown | Every trading day (server time) | A single bad session compounding into next day's grid | Can force a close near a local bottom right before a reversal, locking in a loss the position would have recovered from |
| Overall (peak-to-current) drawdown | Never — measured from account high-water mark | Slow multi-day grid decay that never trips a daily limit | Doesn't catch a fast single-session runaway until it's already large relative to total equity |
Most prop-firm rulesets (and funded-account challenges) enforce daily limits, so if that's your context, mirror it in the EA rather than relying only on an overall check: the firm closes your account on the daily breach regardless of what your overall guard says.
We generally run both, with the daily limit tighter. A 5% daily / 15% overall pairing gives the grid room to recover from an intraday drawdown without letting one bad week accumulate silently across five sessions.
We've watched traders backtest a grid EA on gold, see a 3% max drawdown over five years, and go live with real size the same week. The account is down 25% by week three.
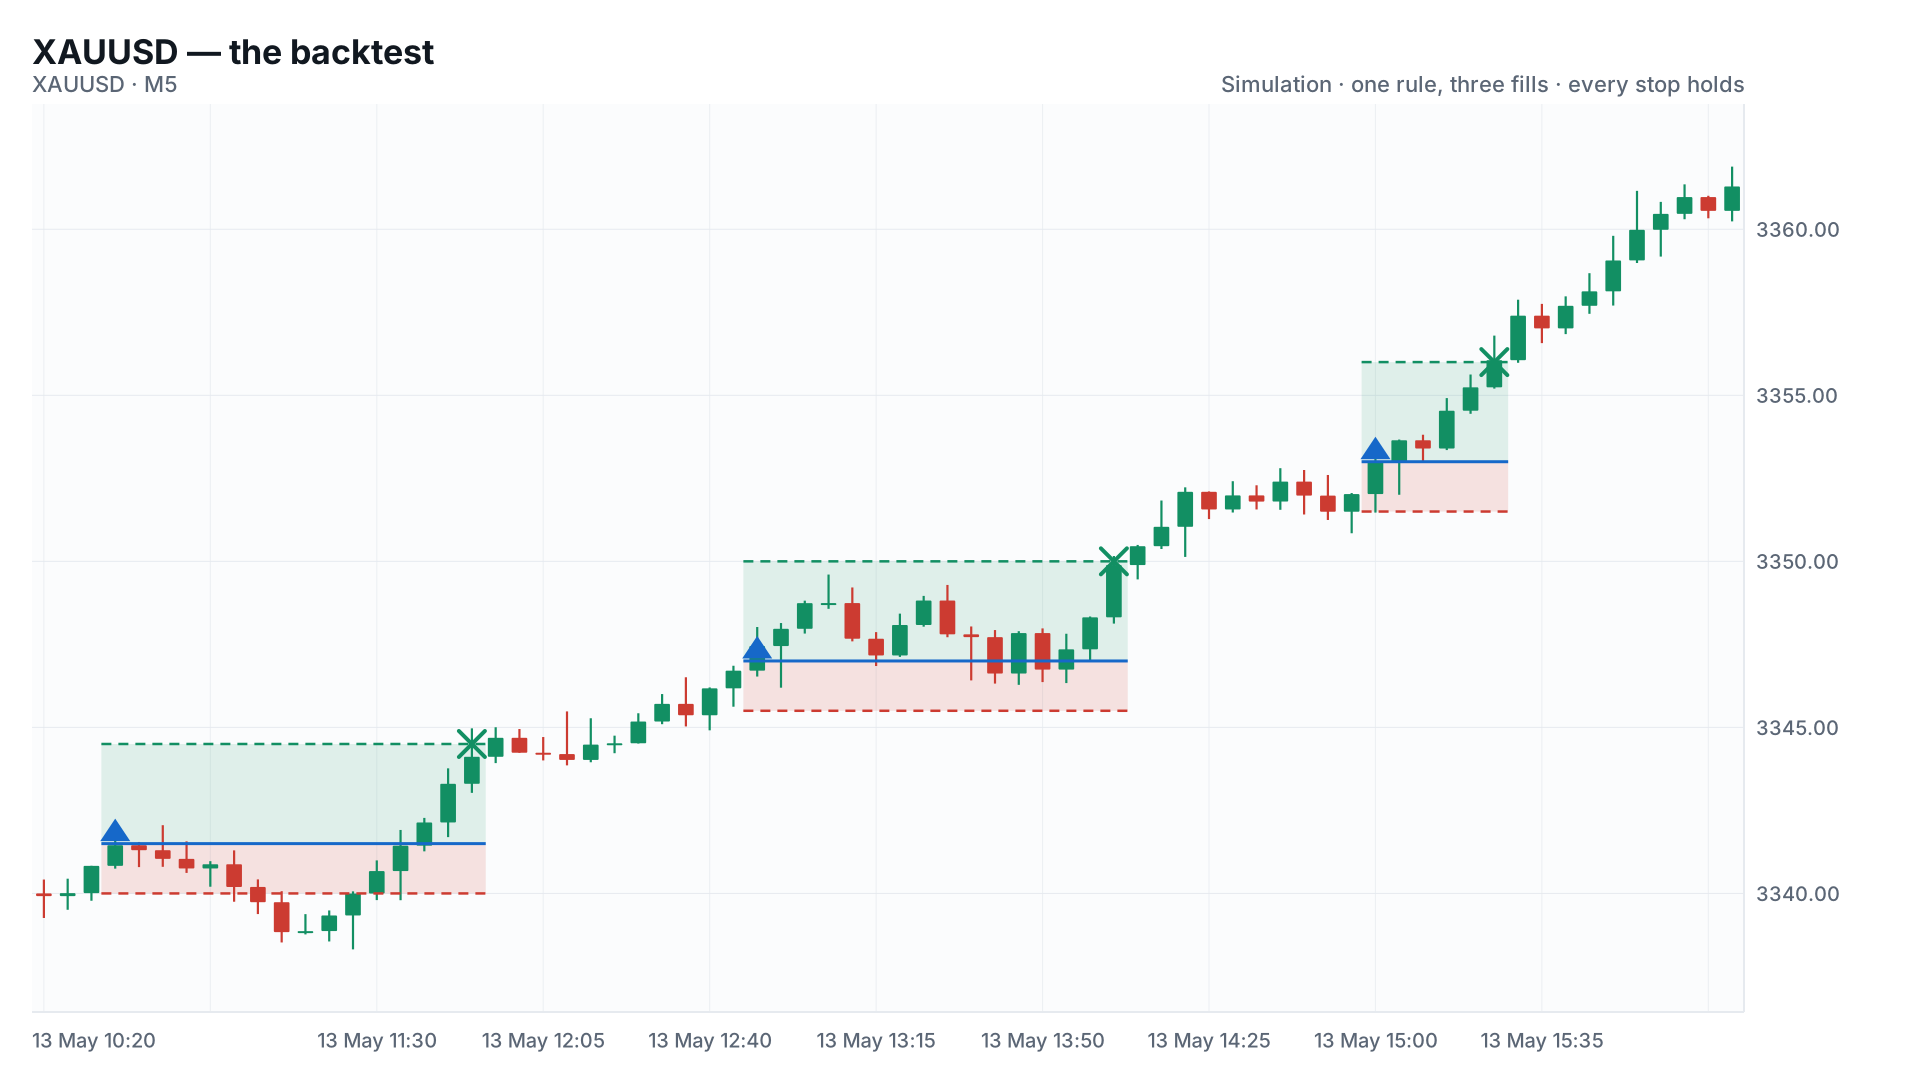
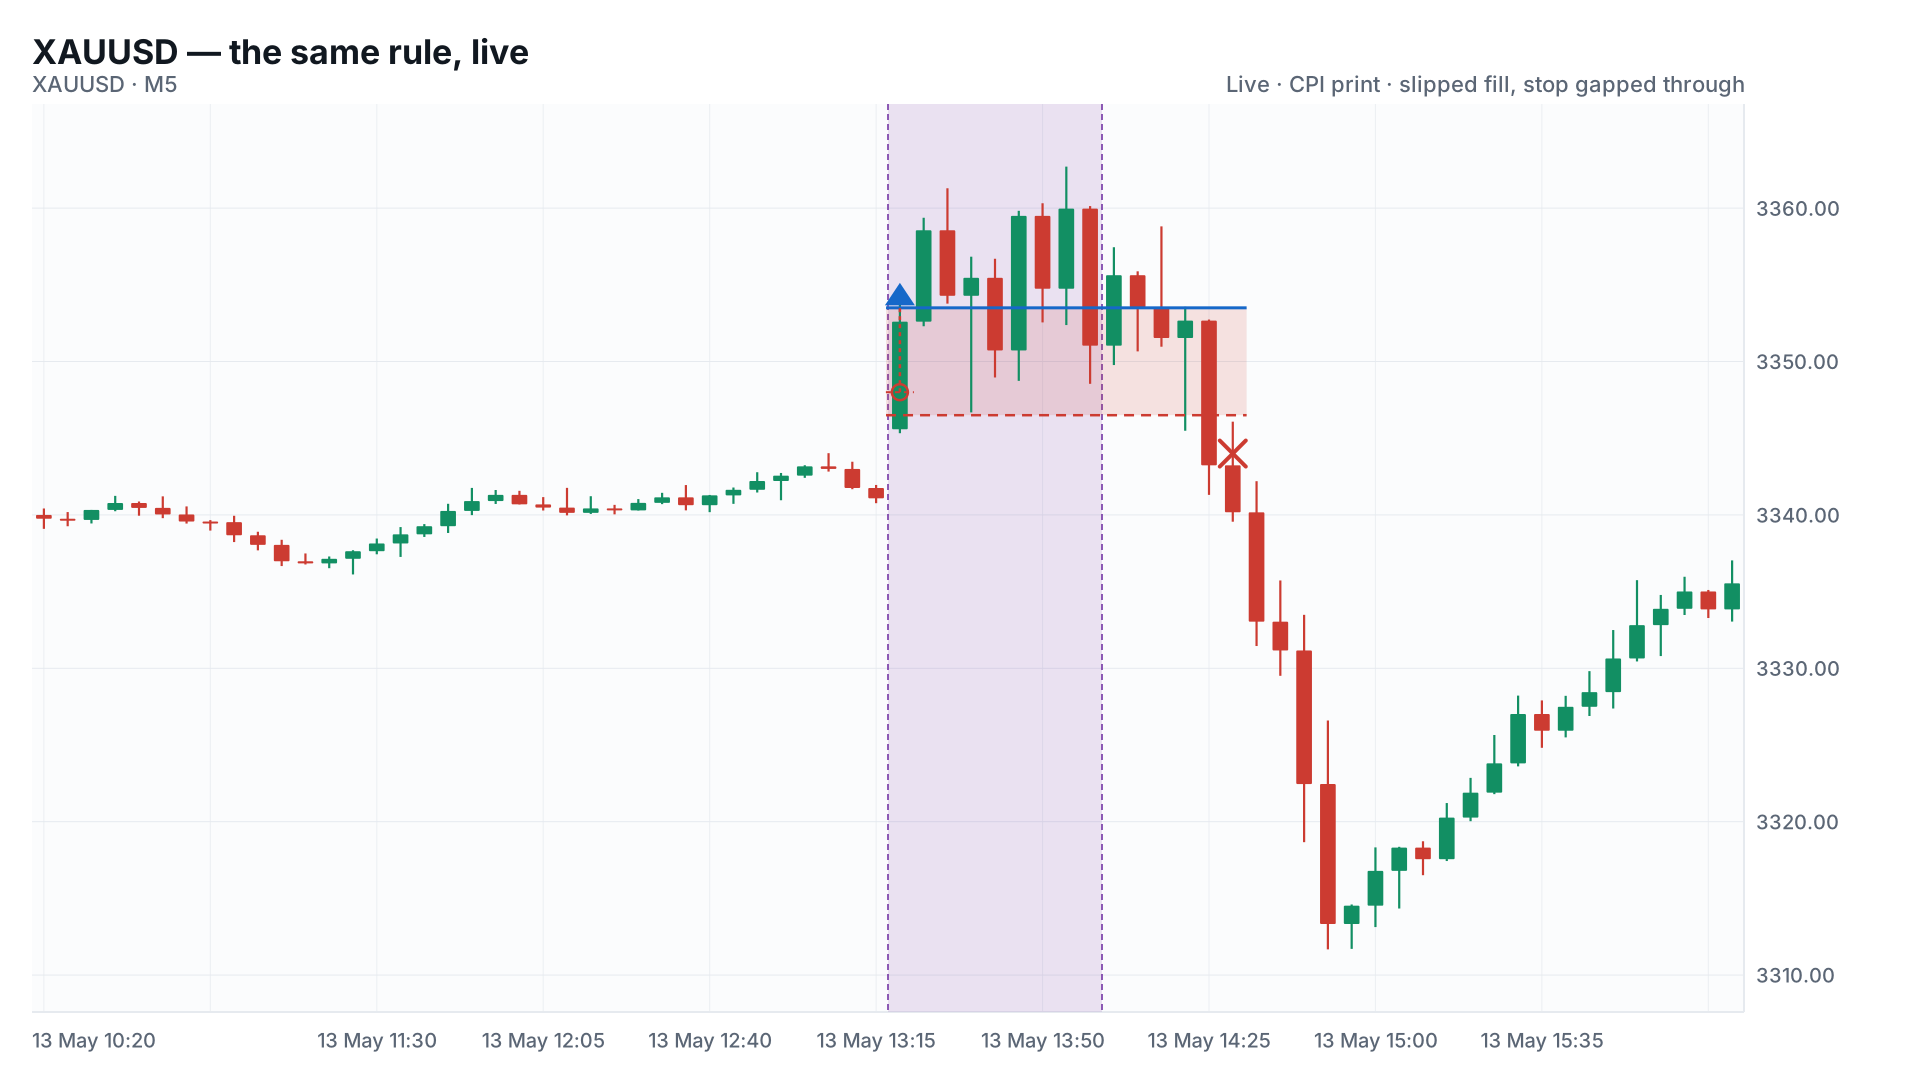
The Strategy Tester's modelling quality depends on the tick data available for the symbol and period. MetaTrader 5's own documentation on the tester is explicit that spread and slippage are simulated, not historically reproduced tick-for-tick, unless you're using real broker tick data with variable spread enabled. Gold is a wide-spread, fast-moving instrument during news windows, exactly the conditions under which a grid EA adds its most expensive levels, and exactly the conditions a backtest is least equipped to reproduce faithfully.
A grid strategy is disproportionately exposed to this gap versus a single-entry strategy, because every additional basket level compounds the slippage error. A backtest showing five grid levels at clean, evenly-spaced fills is measuring a market that doesn't exist during a real gold spike.
Run your backtest with real tick data where your broker supports it, and treat the reported drawdown as a floor, not a ceiling. See our breakdown of why MT5 EAs fail on live accounts for the fuller list of backtest-to-live gaps we keep running into.
Grid and martingale systems aren't the only way to trade gold systematically, and for traders who've already been burned once, they're often not the way back in.
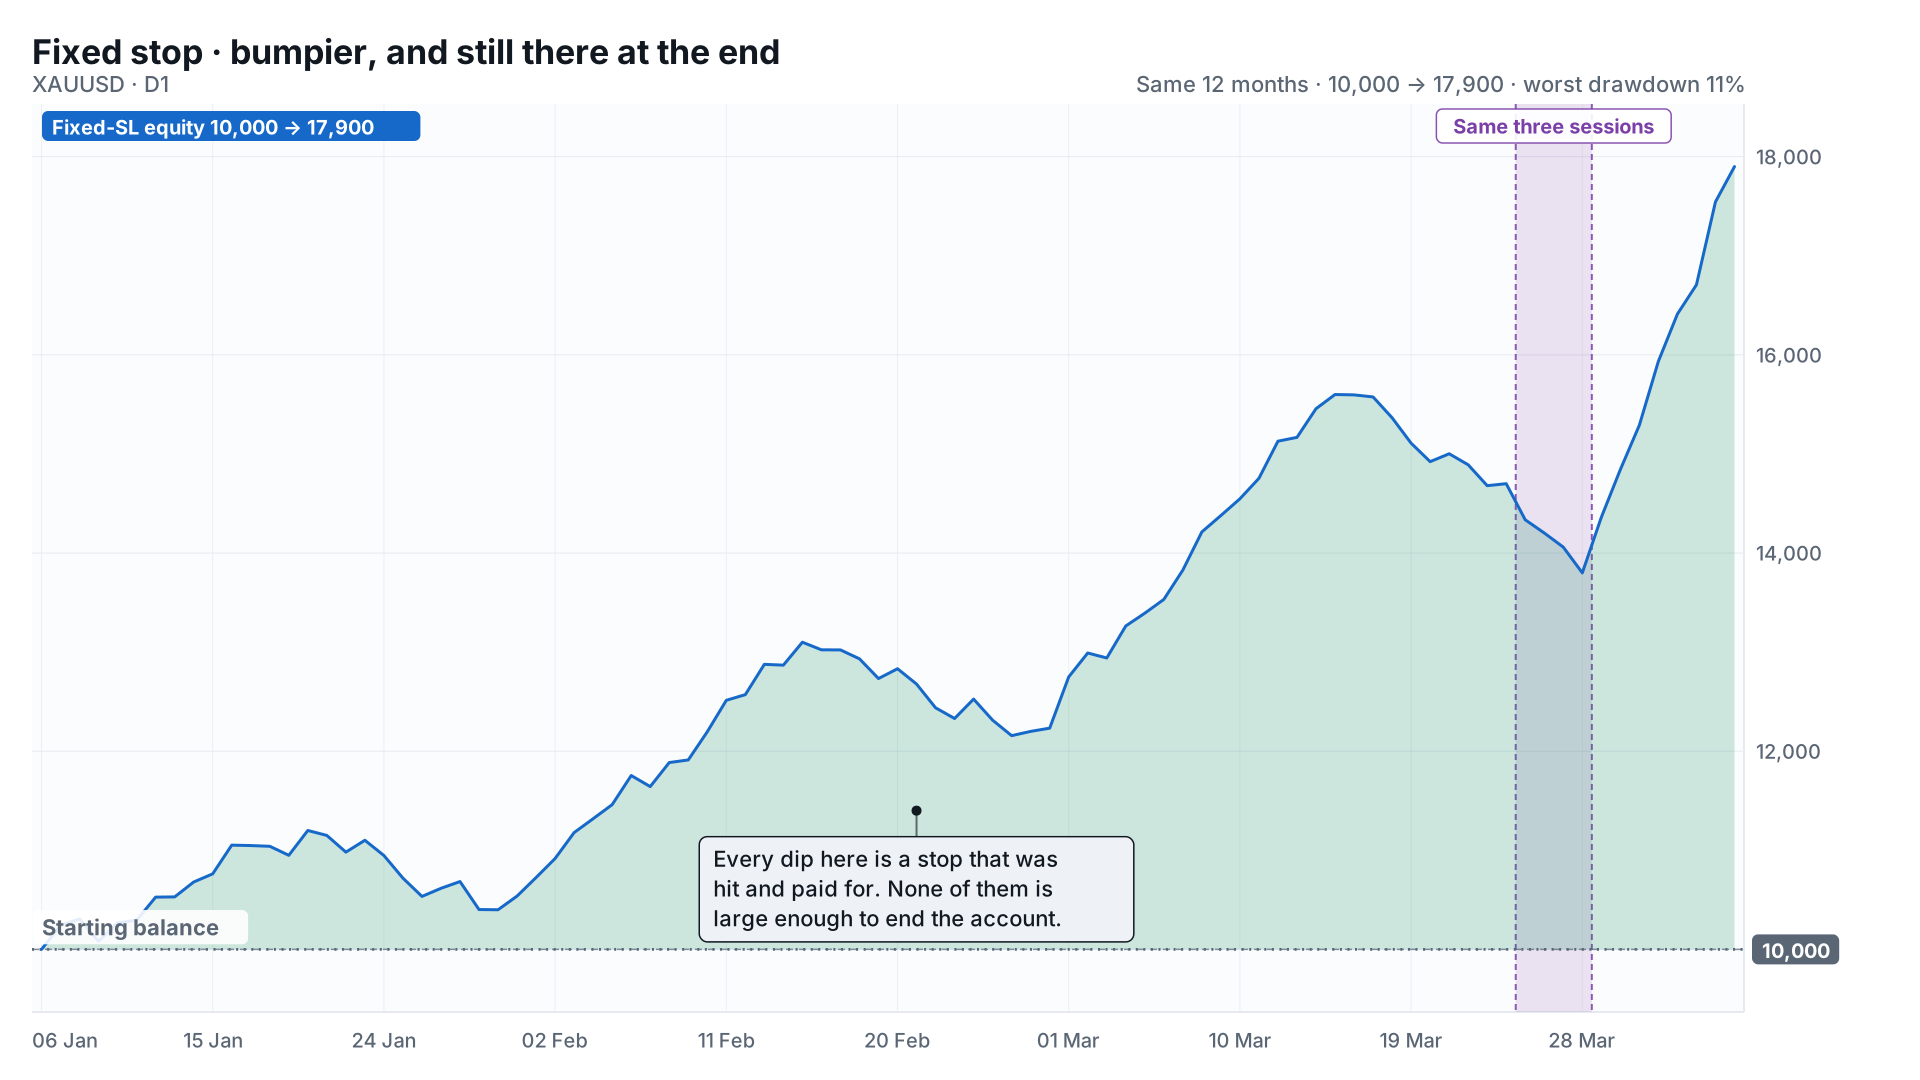
A fixed-stop-loss EA with a defined risk per trade (0.5–1% of equity, say) never has the geometric-loss problem, because there's no scaling logic to cap. The trade-off is a lower theoretical win rate and a less smooth equity curve: grid systems are engineered to produce a long string of small wins punctuated by rare, large losses. Fixed-SL systems spread that risk more evenly and are easier to reason about under stress, which, on a losing Friday, counts for something. If you'd rather stay automated without the scaling risk, Trendline PRO and Trendline EA trade from your own drawn trendlines with fixed, rule-based risk per entry instead of a martingale multiplier, so a losing trade closes at its defined stop rather than triggering the next grid level.
If you're evaluating whether to keep tuning the grid or rebuild around fixed risk, that's a strategy decision, not a code fix, but the equity guard above should go in either way.
Every guard function above lives inside the EA itself, which means it inherits every risk an EA carries: a terminal crash, a VPS reboot, a broken update that silently disables OnTimer().
We built Equity Tracker MT5 for exactly this gap: it watches floating equity drawdown independently of any EA's internal logic, so a runaway grid gets flagged before margin call, not after the fact from a broker email.
An equity guard coded into the EA is necessary but not sufficient, because it fails silently in exactly the scenario it exists to catch: the EA crashing or hanging under load.
These are the primary sources behind the trading-function and backtest-modelling claims made above:
Add the equity guard, cap the grid and lot multiplier, and derive spacing from ATR before the next volatile week does it for you.
 Risk Management
A trailing drawdown lock ratchets up with every new equity high and never gives ground back. Most EAs have no idea it exists.