 Trading Tools
ChartDeck PRO: MT4/MT5 Indicator Panel
ChartDeck PRO docks seven MT4/MT5 chart tools (Triple MA, Bollinger Bands, ZigZag, S/R, Pivots, Sessions, Daily News) into one alert-ready panel.
If you use MetaTrader, you know the struggle. You run a backtest. You export the report. What you get is a messy HTML file that looks like it was designed in…
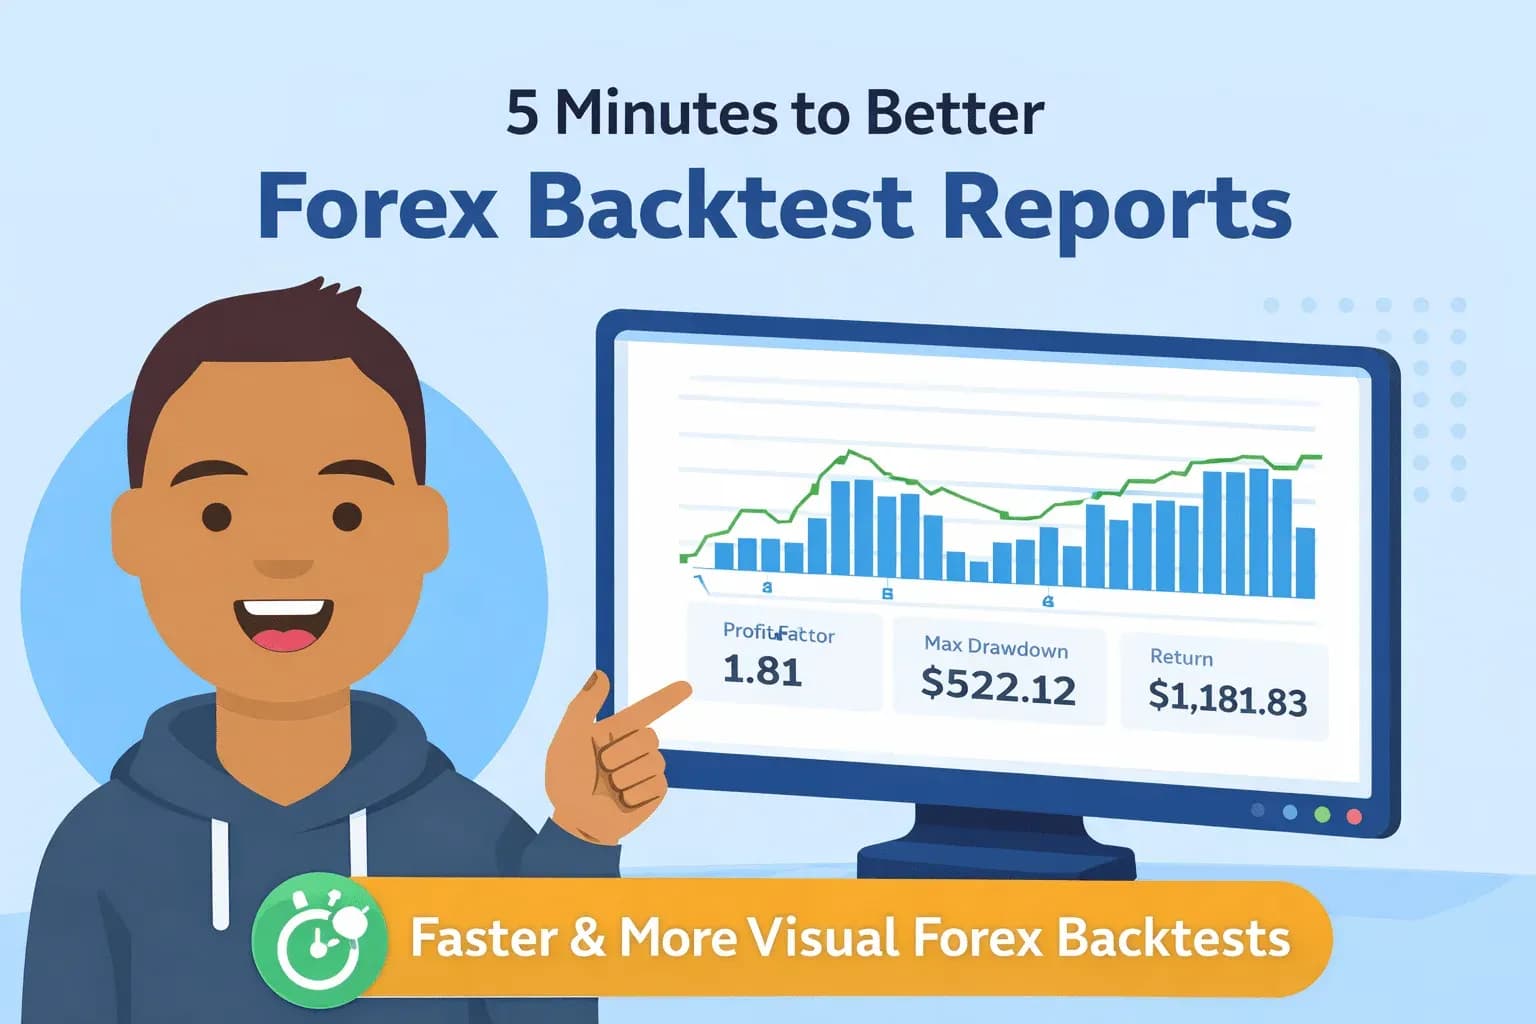
If you use MetaTrader, you know the struggle. You run a backtest. You export the report. What you get is a messy HTML file that looks like it was designed in 1998. It's hard to read, harder to analyze, and embarrassing to share. I wanted something better. I wanted a way to turn raw data into something useful. I wanted to see my edge clearly, without squinting at a spreadsheet.
Most traders spend hours optimizing their strategy settings, then spend about 30 seconds reading the report. That's a mistake. Your backtest report is a full breakdown of how your strategy behaves under different market conditions, not just a pass/fail result. Standard reports from MetaTrader give you the numbers, but they don't give you the story. To trade like a professional, you need visual clarity on your drawdowns, profit factors, win rates, and trade distribution over time. So, I built Better Backtest Reports. It's a simple, free tool to bridge that gap.
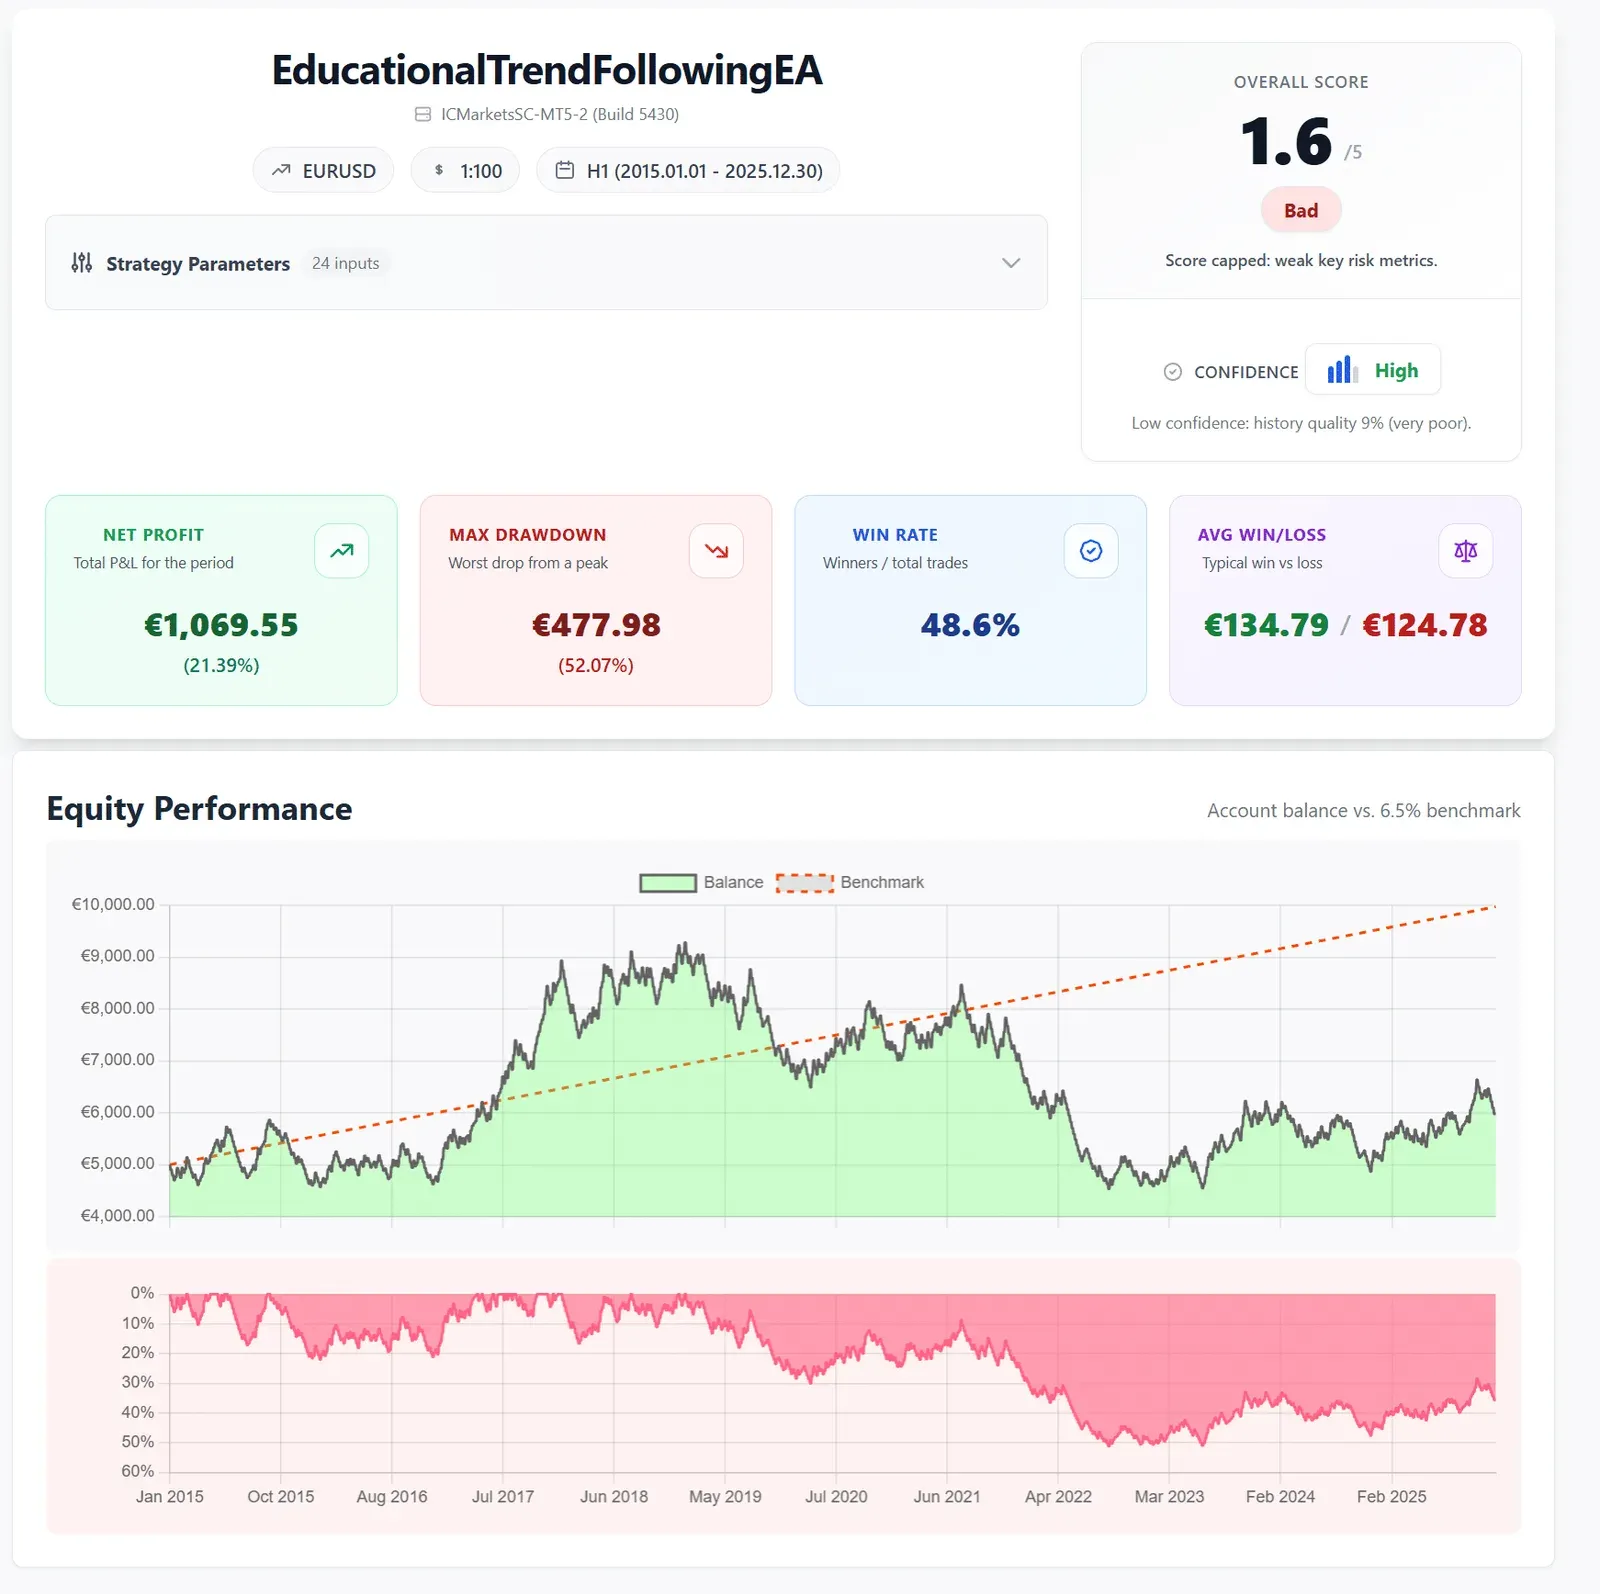
Once you have a clean, readable report, the next step is knowing what to focus on. Here are the key metrics every trader should understand:
Profit factor is gross profit divided by gross loss. A value above 1.5 is generally considered a healthy strategy. Below 1.0 means the strategy lost money. While simple, it's one of the most reliable single-number indicators of strategy quality.
This tells you the largest peak-to-trough decline your equity experienced during the test. A strategy with great returns but a 60% drawdown is unlikely to be tradeable in real life. Most traders would abandon it emotionally long before it recovers. Aim for a maximum drawdown under 20% relative to your expected annual return.
A high win rate alone means nothing. A strategy that wins 80% of trades but loses 5x more on losers than it gains on winners is unprofitable. Always evaluate win rate together with your average win vs. average loss.
A backtest with 10 trades over 3 months proves very little. Statistical significance requires a minimum of 200–300 trades across multiple market conditions: ranging periods, trending periods, volatile and quiet markets. The longer and more varied your test period, the more trustworthy the results.
A smooth, upward-sloping equity curve is a sign of a consistent strategy. Long flat periods followed by sharp spikes suggest the strategy only works in specific conditions. Sudden drops suggest exposure to news events or gaps that your backtest didn't account for properly.
Curve fitting / over-optimization: If you tweak your settings until the backtest looks perfect, you're fitting your strategy to past noise, not discovering a genuine edge. A good strategy should work reasonably well with a range of settings, not just one specific combination. Ignoring slippage and spread: MetaTrader's default backtest uses fixed spreads, which are often lower than what you'll face in live trading, especially around news events. Always run backtests with realistic spread and slippage settings enabled. Testing on a single currency pair: A strategy that works brilliantly on EUR/USD but fails on GBP/USD or USD/JPY may only be capturing pair-specific quirks. Well-generalized strategies tend to show positive results across multiple instruments. Ignoring out-of-sample testing: Reserve a portion of your data (e.g. the last 6 months) and don't touch it during optimization. Use this unseen data to validate your strategy after you've finalized your settings. If results collapse on out-of-sample data, your edge is likely not real.
The core problem with MetaTrader's default HTML export is that it buries the most important information in a wall of numbers and a single static equity curve. When you're trying to compare two versions of a strategy, or explain results to a trading partner, that format simply doesn't work. Better Backtest Reports solves this by presenting your results visually and interactively, so you can spot patterns, share clearly, and make decisions faster. It's free. No account is required. I built it for my own trading, and I hope it helps yours too. Check out the tool here: Better Backtest Reports – Free MT4/MT5 Report Visualizer
Looking for MT5 tools to complement your backtesting workflow? Browse our indicators and EAs.
Before you treat any report as tradeable evidence, verify the basics manually. Check whether the spread setting matches your broker, whether commission and swaps are included, and whether the modelling mode uses real ticks rather than a simplified bar model. Then rerun the same EA across at least two adjacent date ranges. A system that only works on one isolated window is usually curve-fit rather than consistent across different periods.
The next step is forward validation. Run the same settings on a demo account for several weeks and compare live fills, slippage, spread expansion and missed ticks against the historical report. If the live equity curve behaves differently, reduce size or keep the system in research mode. Backtests are a filter, not a permission slip.
For paid or prop-firm accounts, document every assumption: broker, symbol suffix, timeframe, data source, GMT offset, spread, commission, risk per trade and maximum daily drawdown. This makes it much easier to reject weak systems before capital is exposed.
The moment a backtest report earns its keep is when you change one thing (a filter, a session window, a trailing-stop rule) and need to decide whether the new version is genuinely better or just differently lucky. Never compare headline profit alone. Compare profit factor, maximum drawdown, trade count and the shape of the equity curve side by side. A version that earns 15% less but cuts drawdown in half is usually the better system, because it survives the periods where you would otherwise abandon it.
Keep the test window, spread settings and data source identical between runs; changing the strategy and the test conditions at the same time makes the comparison meaningless. And watch the trade count: if your "improved" filter cut the sample from 400 trades to 60, you have not improved the strategy; you have shrunk the evidence.
If you want to see how we evaluate our own tools this way, the published backtest reports for our EAs show the exact metrics we hold ourselves to.
Trading ToolsChartDeck PRO docks seven MT4/MT5 chart tools (Triple MA, Bollinger Bands, ZigZag, S/R, Pivots, Sessions, Daily News) into one alert-ready panel.
 Trading Tools
Trendline PRO, a new MT5 Expert Advisor for visual traders — draw entry, breakout and close lines on the chart and let the EA execute them.
 Trading Tools
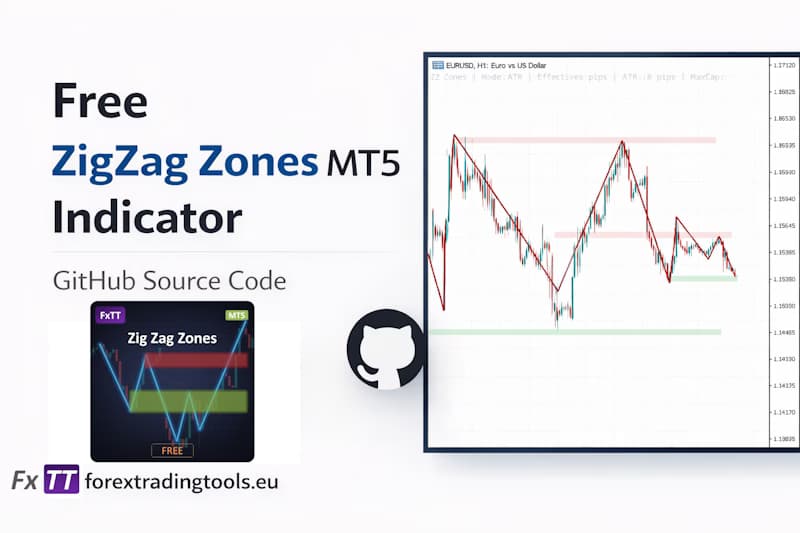
Draw MT5 support and resistance zones automatically from ZigZag pivot clusters — free open-source MQL5 indicator with ATR-adaptive sizing.