
Volume Divergence Signals & Reversals
Learn how to read bullish and bearish volume divergence, filter weak signals, and build a practical reversal trade plan before the crowd notices.
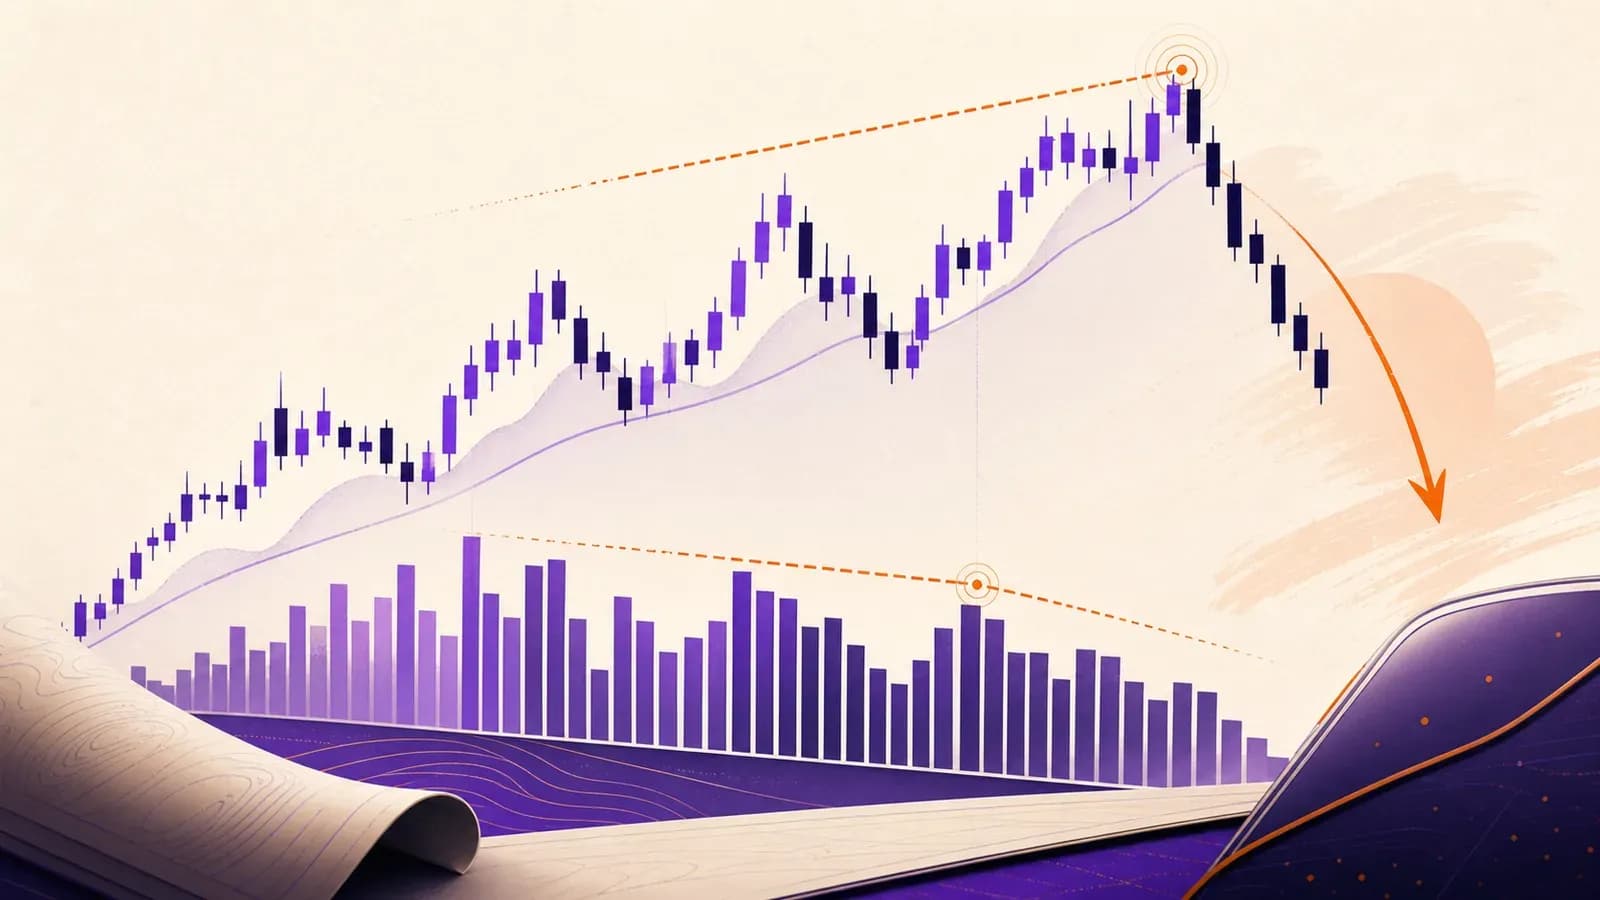
Why Volume Precedes Price
Price tells you where the market went. Volume tells you how much commitment stood behind that move.
Volume divergence appears when price moves in one direction while volume confirms less and less of that move. A new high on falling volume means the market can still lift price, but fewer participants are willing to chase it. A new low on falling volume means sellers can still press price lower, but supply may be drying up.
That matters because major reversals rarely begin with a loud announcement. They often begin with participation fading at the edge of a trend. The chart still looks bullish or bearish, but the effort behind the move is thinning. In human terms: price is still walking up the stairs, but volume is already checking the elevator.
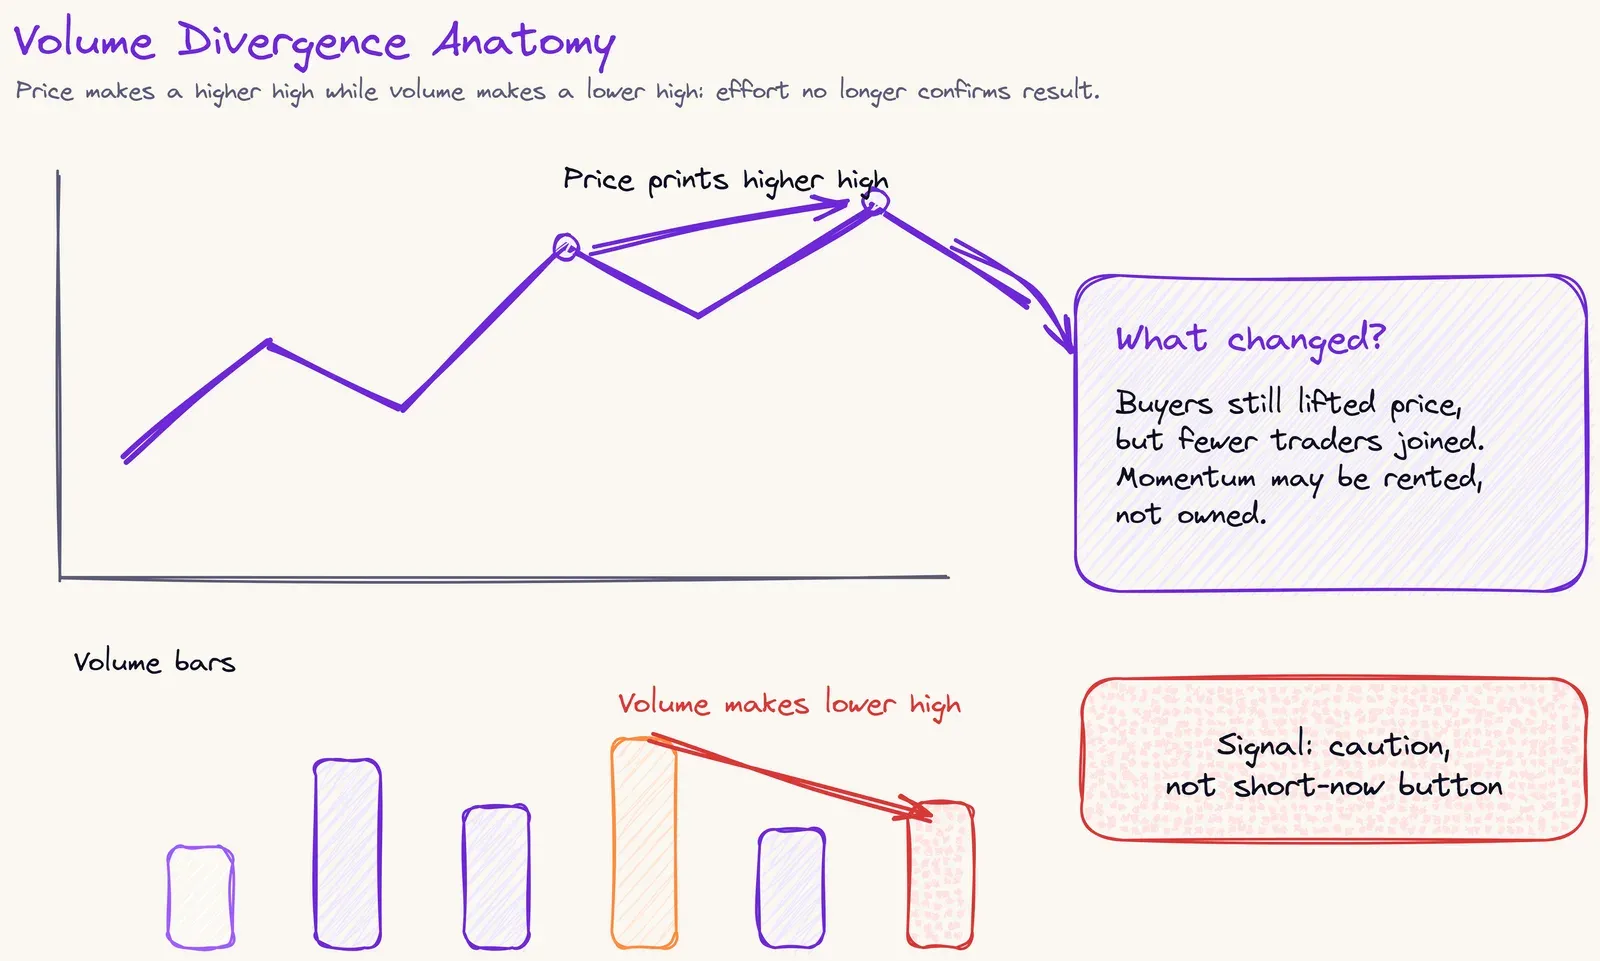
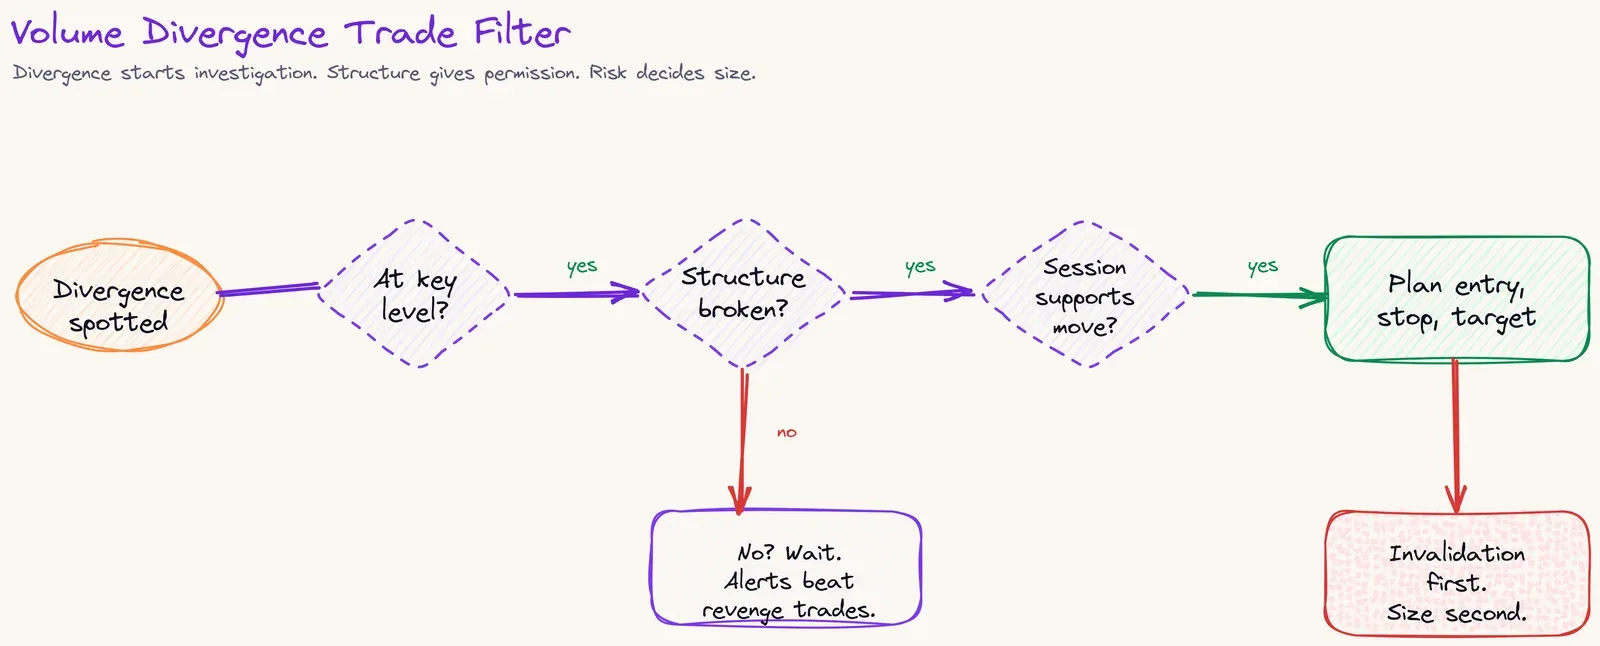
Volume divergence is not a standalone entry trigger. Treat it as an early warning. It says, "pay attention here." Structure, levels, session timing, and risk still decide whether there is a trade.
What Volume Divergence Really Measures
Every trend needs participation. In spot forex, volume usually means tick volume: the number of price changes during a candle, not centralized exchange volume. Tick volume is still useful because active markets tend to print more ticks, and quiet markets print fewer.
Think in three parts:
- Effort: volume expansion or contraction during the move.
- Result: how far price travels from that effort.
- Location: where the effort happens on the chart.
The cleanest reversal clues appear when effort and result disagree at an important location. If price makes a fresh high into resistance but volume expands poorly, buyers may be losing control. If price makes a fresh low into support but selling volume fades, sellers may be running out of inventory, caffeine, or both.
Bullish vs Bearish Divergence
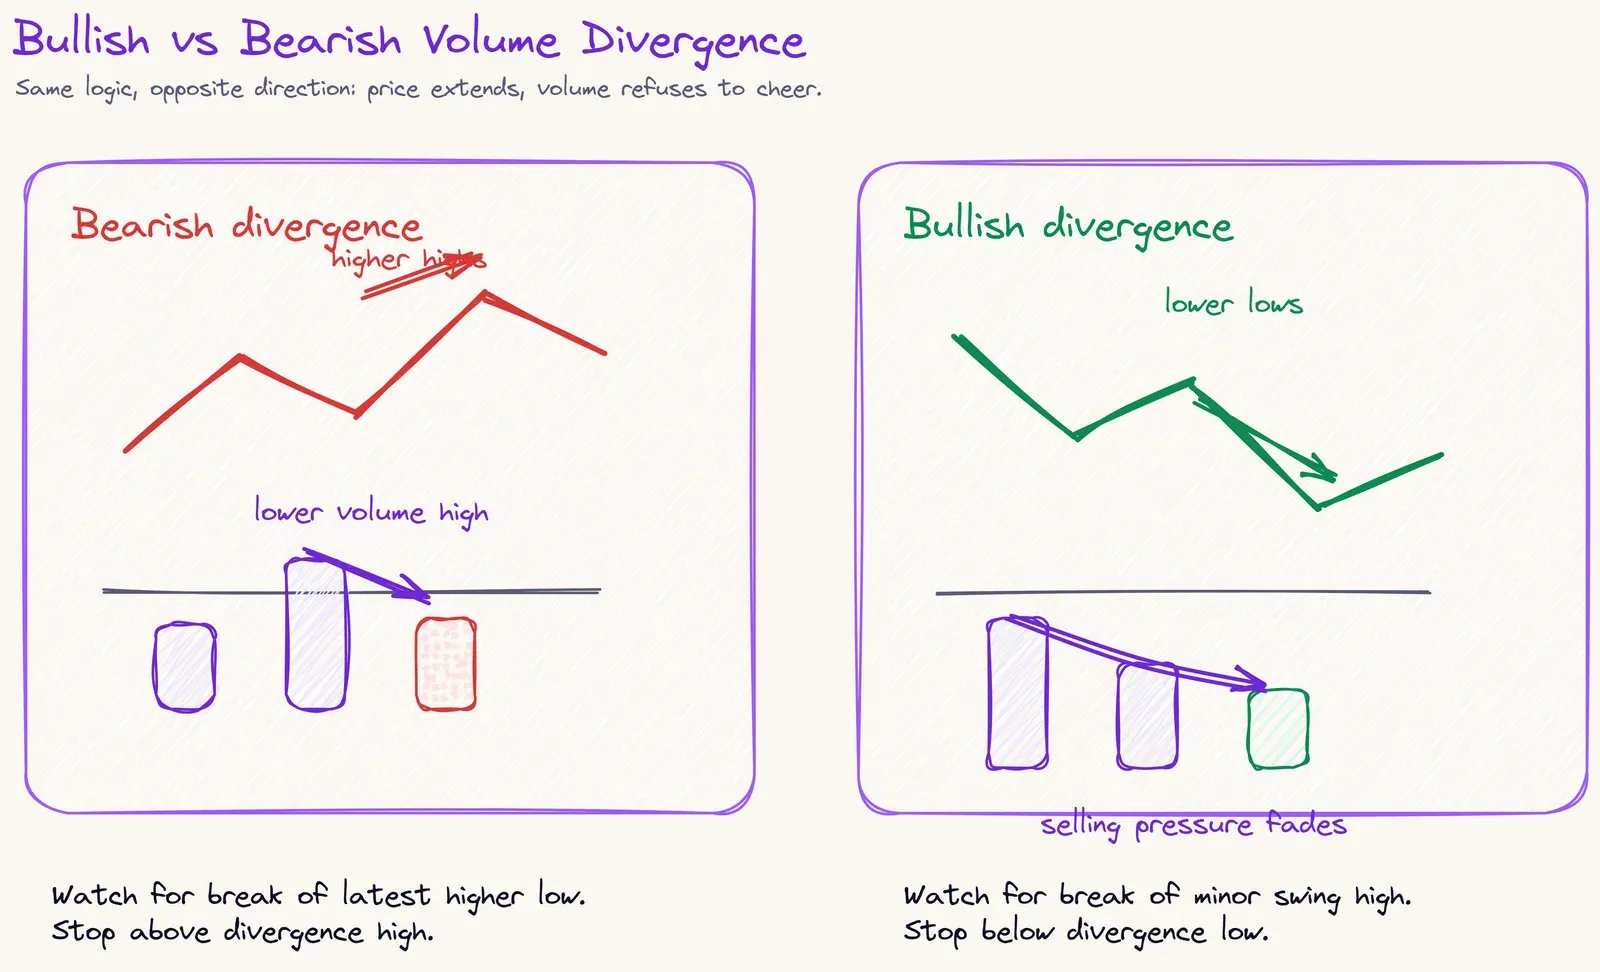
Bearish volume divergence forms when price makes a higher high, but volume makes a lower high. The market is still rising, but the move has weaker participation. This is most useful near resistance, liquidity sweeps above prior highs, or late-stage trend extensions.
Bullish volume divergence forms when price makes a lower low, but volume makes a lower high or contracts sharply. The market is still falling, but fewer sellers are joining. This is most useful near support, higher-timeframe demand, or liquidity sweeps below prior lows.
Do not read every volume dip as divergence. Markets breathe. Lunch sessions go quiet. Holidays flatten everything. A weak volume print in a dead session is not hidden institutional wisdom; sometimes it is just traders eating sandwiches.
Three Volume Divergence Patterns
1. Climax Volume Reversal
A climax volume reversal appears near the end of a mature trend. Price pushes into a new extreme with a large volume spike, then fails to continue. The next candles often show rejection: long wick, engulfing candle, doji, shooting star, hammer, or strong close back inside the prior range.
This pattern says the market spent a lot of effort but got poor follow-through. In an uptrend, buyers may have exhausted demand into resistance. In a downtrend, sellers may have dumped into support and found no fresh supply.
How to trade it: Wait for a lower high after a bearish climax or a higher low after a bullish climax. Enter only after the corrective structure breaks. Place the stop beyond the climax wick, because that wick is the invalidation point.
2. Distribution on Higher Highs
Distribution divergence forms when price keeps making higher highs, but each push attracts less volume. The trend looks healthy to late buyers, yet participation is fading. This often appears after an extended rally, near higher-timeframe resistance, or after a liquidity sweep above a visible high.
The key is not the first weak high. The key is the sequence. One weak push can be noise. Two or three weak pushes into the same zone show a market that needs more effort to travel less distance.
How to trade it: Mark the rising swing structure. Wait for price to break the latest higher low. A break of structure confirms that distribution has likely shifted from quiet selling into visible reversal pressure. Enter on the break or on a retest, depending on your style and spread conditions.
3. Accumulation on Lower Lows
Accumulation divergence is the inverse pattern. Price makes lower lows, but volume contracts as the selloff continues. Sellers still push price down, but each new low attracts less participation. This can signal absorption: stronger buyers quietly accepting supply without allowing a full collapse.
This pattern works best when it forms at support, below a prior low, or inside a higher-timeframe demand zone. A lower low in the middle of empty chart space is weaker. Location matters because reversals need a reason to reverse.
How to trade it: Wait for price to reclaim a minor swing high. That break shows sellers lost short-term control. Conservative traders can wait for a pullback into the broken level. Stop goes below the divergence low.
The Confirmation Stack
Volume divergence becomes useful when it joins other evidence. The best setups usually have at least three of these:
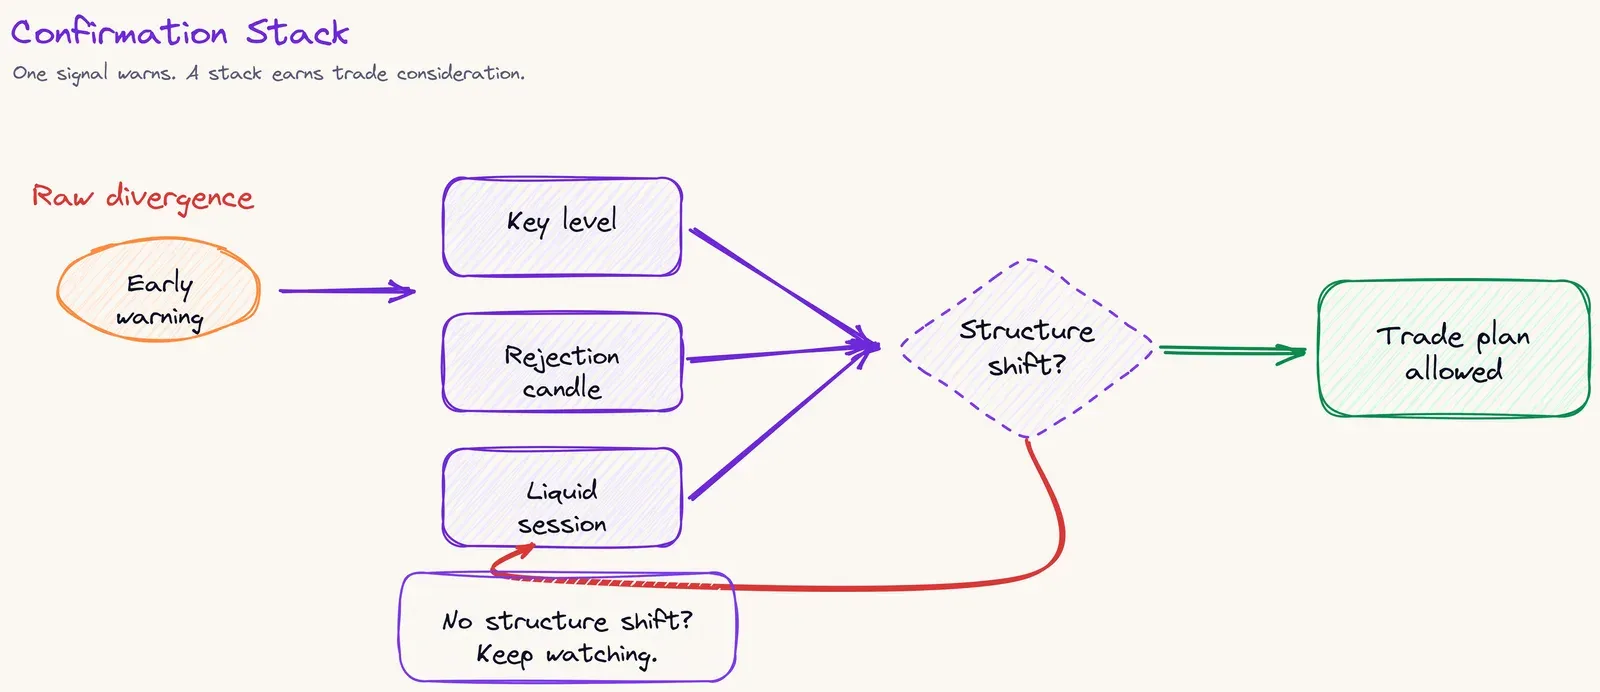
- Higher-timeframe level: support, resistance, order block, liquidity pool, trendline, or round-number zone.
- Divergence sequence: at least two comparable swings, not one random candle.
- Reversal candle: rejection wick, engulfing candle, pin bar, strong close through prior candle body.
- Structure shift: lower high breaks in bearish setups; higher low breaks in bullish setups.
- Session timing: London open, New York open, or overlap often gives cleaner confirmation.
- Risk room: enough distance to target before the next opposing level.
No stack, no trade. The market does not owe you a reversal because one histogram bar looked tired.
Filtering False Signals
Not all volume divergences lead to reversals. Some only lead to sideways chop. Others fail because the broader trend is still too strong.
Use these filters before risking capital:
- Trend age: divergence after a long trend is stronger than divergence after one impulse.
- Location: divergence at an established support/resistance level carries more weight.
- Candle close: wait for rejection or a structure break, not just an intrabar wick.
- Volume baseline: compare volume against nearby candles, not against memory.
- News risk: scheduled news can override clean technical reads.
- Liquidity quality: thin sessions create fake divergence more often.
Practical Entry Models
Aggressive Model
Use when the divergence forms at a major level and the reversal candle is strong.
- Mark the divergence swing.
- Wait for a rejection candle.
- Enter after the candle closes.
- Place stop beyond the wick.
- Take partial profit at the nearest structure level.
This model gives earlier entries but more false starts. It is best for experienced traders who can accept being wrong quickly.
Conservative Model
Use when you want confirmation before entry.
- Mark the divergence swing.
- Wait for market structure to break.
- Wait for a retest of the broken level.
- Enter on rejection from that retest.
- Place stop beyond the retest swing.
This model misses some fast reversals, but it avoids many weak signals. Fewer trades, cleaner decisions, less emotional furniture damage.
Stop Loss and Targets
Your stop should sit beyond the point that invalidates the divergence idea:
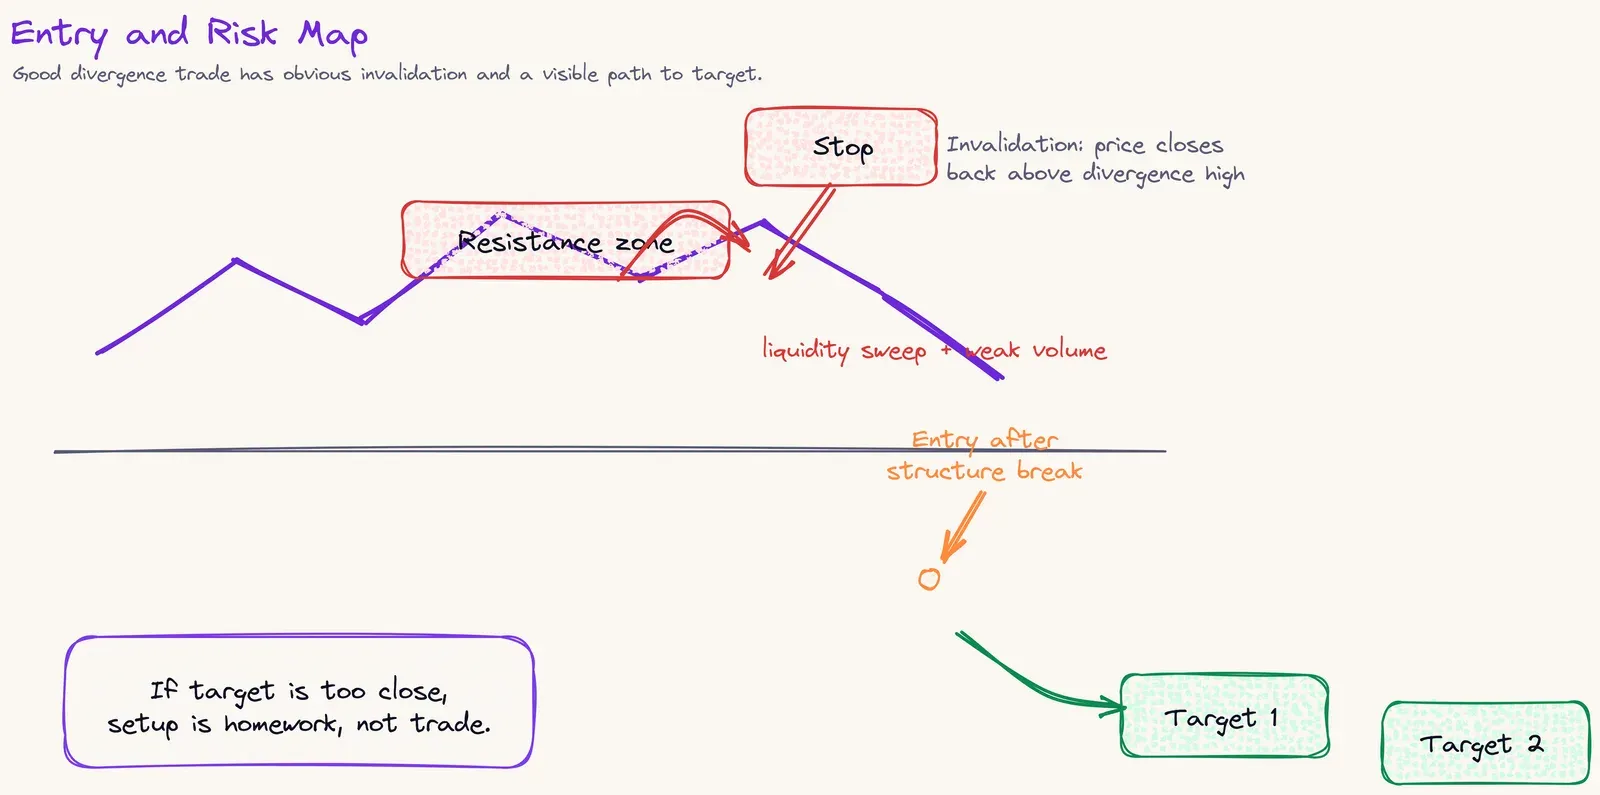
- Bearish setup: stop above the divergence high or retest high.
- Bullish setup: stop below the divergence low or retest low.
Targets should come from structure, not hope. Common targets:
- Prior swing low or swing high.
- Opposite side of the range.
- Higher-timeframe support/resistance.
- Liquidity resting above or below recent equal highs/lows.
If the first target is too close to provide acceptable reward-to-risk, skip the trade. A beautiful setup with poor reward-to-risk is still a poor trade wearing nice shoes.
Common Mistakes
- Entering before structure confirms: divergence can persist for many candles.
- Comparing unrelated swings: compare similar swing points, not random candles.
- Ignoring trend strength: strong trends can absorb weak divergence and continue.
- Trading dead sessions: low volume during quiet hours proves little.
- Moving stops: once invalidation is hit, the trade idea failed.
- Forcing reversal bias: divergence warns, it does not guarantee.
Quick Checklist
Before taking a volume divergence trade, answer these:
- Is price at a meaningful level?
- Are there at least two comparable swing points?
- Does volume clearly disagree with price?
- Has candle structure shown rejection?
- Has market structure shifted?
- Is the session liquid enough?
- Is the stop location obvious?
- Is reward-to-risk acceptable before the next key level?
If several answers are "no," pass. A missed trade costs nothing. A forced trade sends tuition invoice.
Bottom Line
Volume divergence is an early warning that participation no longer supports price as strongly as before. The strongest signals appear at key levels, after mature trends, and before a visible structure shift.
Use divergence to prepare, not to predict. Let price confirm. Let risk define size. Then execute only when the chart gives enough evidence to justify the trade.
Want divergence and structure signals in one MT5 panel? Check out the Multi-Indicator Panel for MT5.