 Technical Analysis
10 Best Free MT5 Indicators (2026)
10 free MT5 indicators for trend, structure, momentum, correlation, sessions, and pivots, all free with no trial and no expiry.
Moving averages and trend lines are two of the most popular — and misunderstood — tools in technical analysis. Seven differences that matter.
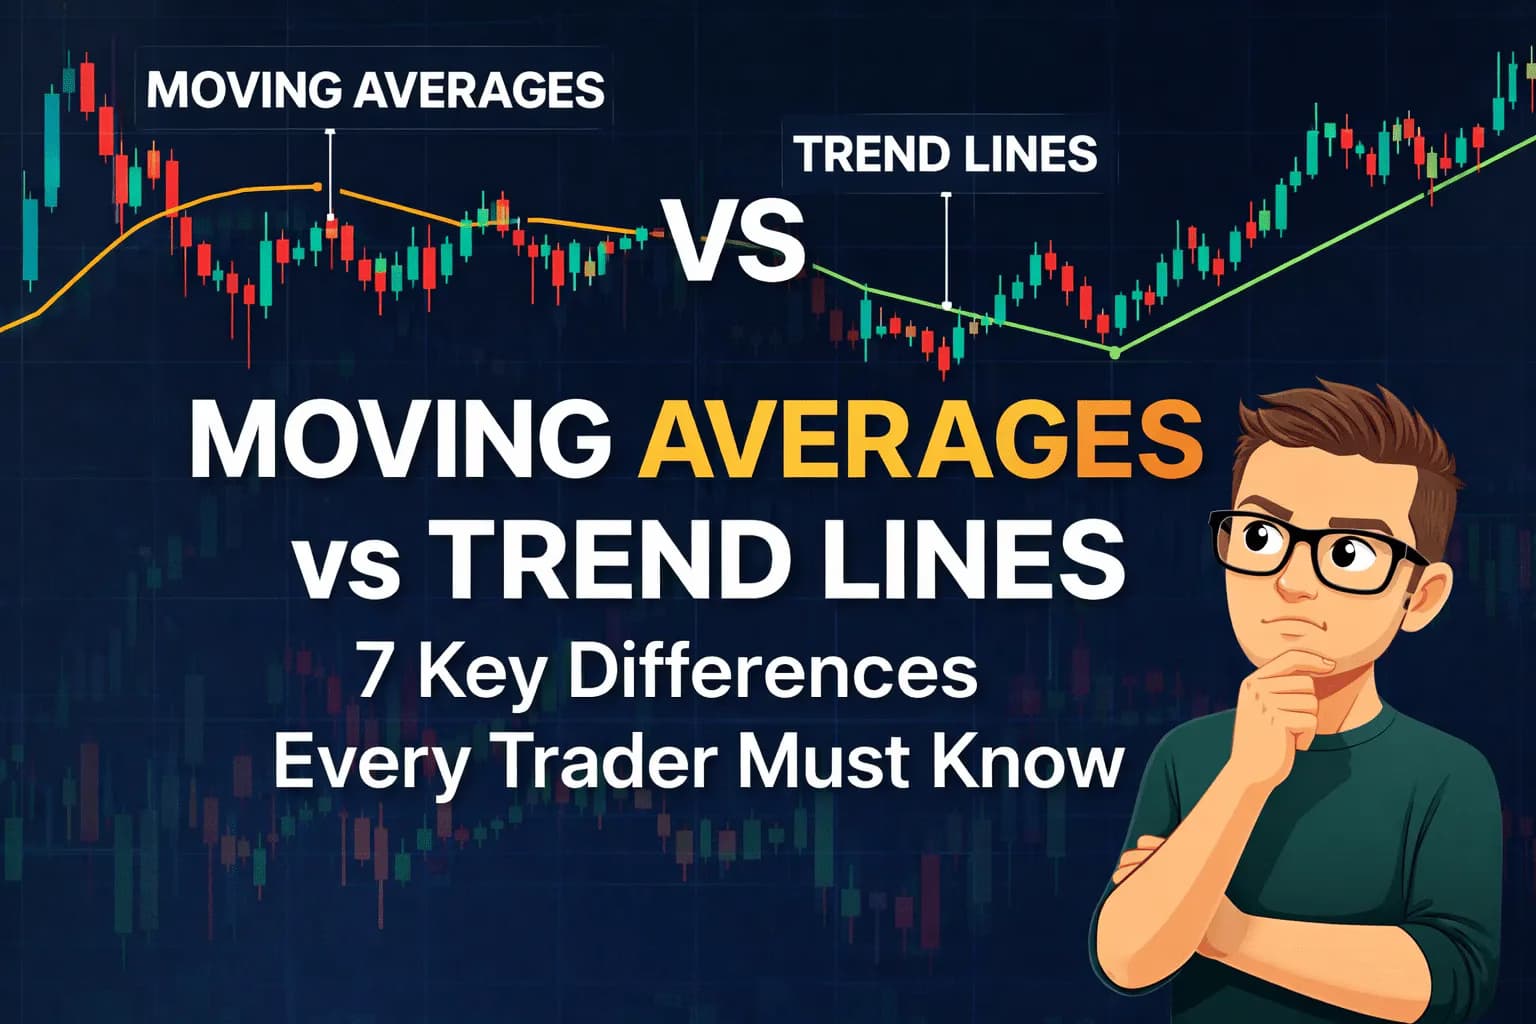

In technical analysis, few tools are as popular (or as misunderstood) as moving averages and trend lines.
Both help traders identify trend direction, find entries/exits, and avoid fighting the market. But they behave differently, work best in different conditions, and suit different trading styles.
In this guide, you’ll learn moving averages vs trend lines with clear examples, a quick comparison table, and the 7 key differences you can apply immediately.
A moving average (MA) is a chart tool that smooths price fluctuations so you can see the underlying direction more clearly. Think of it as a noise filter: it reduces random spikes and makes trends easier to spot.
Moving averages are calculated from historical price data. That makes them objective (same settings → same line), and easy to test and automate.
Not all moving averages behave the same. The most common types are:
A 20-period MA continuously averages the last 20 bars (on whatever timeframe you’re viewing). You can calculate it using the close, open, median, high/low, etc. depending on your platform and preference.
The key tradeoff is simple:
Moving averages are best used for trend definition and signal confirmation. They adapt automatically to price, which is why they’re popular in discretionary and algorithmic trading alike.

A classic approach is using the 200-period moving average as a “market regime” filter:
This is simple, repeatable, and works particularly well on higher timeframes where noise is lower.
Another common use is a crossover system, typically with a faster MA (e.g., 20) and a slower MA (e.g., 50):
Practical tip: Many traders improve crossovers by adding multi-timeframe confirmation. If you like that style of trading, one of the best MT4 indicators, such as MTF Triple Moving Averages, can help you quickly check whether multiple timeframes agree (useful as a filter rather than a "magic signal generator"). Our multi-timeframe trading in MT5 guide walks through the full workflow if you want to take this further.
Below are examples showing how MA signals can look in trending markets, and why ranging markets can be challenging.
Moving Averages vs Trend Lines - Simple Moving Averages example - Buy Entry and Exit
Simple Moving Averages example - Buy Entry and Exit
Buy example (typical rules):
Simple Moving Averages example - Sell Entry and Exit
Sell example (typical rules):
SMA During Ranging Markets
Notice the weakness: in ranges, moving averages can whip back and forth and generate low-quality signals. This is one reason traders often combine MAs with trend lines for better context and more precise levels.
A trend line is a diagonal line drawn on the chart to represent market structure, typically connecting swing lows (support) in an uptrend or swing highs (resistance) in a downtrend.
Trend lines are powerful because they map how traders visually interpret supply/demand. The tradeoff is that trend lines are subjective: different traders may draw them slightly differently.
To keep your trend lines useful (and not random), follow these rules:
Slope matters. A very steep trend line can break easily (it may represent momentum rather than a stable trend). A flatter trend line often lasts longer and behaves more like a durable support/resistance zone.
Trendline with a steep slope
Trendline with a low slope
Trend lines are commonly used in two high-probability ways: as dynamic support/resistance and as breakout structure.
In an uptrend, connect swing lows to form a support trend line. Traders often look for bounces from that line as entry opportunities (especially when the higher-timeframe trend is still intact).
Trend Lines Buy Entry and Exit
In a downtrend, connect swing highs to form a resistance trend line. Traders often look for rebounds from that line as sell opportunities.
Trend Line Sell Entry and Exit
Trend line breakouts can be profitable when they happen after consolidation, because the market has “stored energy” and a break can trigger momentum.
Bearish Break Out
Bullish Break Out
Risk note: Both tools can generate false signals. That’s why risk management matters. And because floating drawdown is often invisible if you only watch balance, monitoring equity in real time can add discipline, tools like Equity Tracker MT5 are designed to make that part easier (especially during trending phases and breakout volatility) without changing your strategy.
This is the core of the topic. If you remember only one section, make it this one.
The best choice depends on your trading style, your experience level, and whether you want to automate your approach.
Moving averages are typically better for beginners because they’re objective and consistent. You can follow simple rules (like the 200 MA bias) and avoid overthinking.
Moving averages win again here. They’re easy to define, code, backtest, and optimize. Trend lines can be approximated in code, but it’s harder to do reliably across instruments and market regimes.

This is where many experienced traders end up:
And regardless of which tool you prefer, risk management should stay objective. If you’re trading MT5 and want a clearer view of floating risk, tracking equity changes (not just balance) can help you stick to your rules (especially during trend pullbacks and breakout volatility).
Neither is “better” universally. Moving averages are objective and great for trend direction. Trend lines offer flexibility and precision for levels, entries, and breakouts.
Yes. A common approach is: moving averages for trend bias, trend lines for timing and structure.
Moving averages. They are rule-based and straightforward to backtest. Trend lines are harder to automate because drawing them is subjective.
Moving averages tend to be more reliable on higher timeframes (H4, Daily, Weekly) where noise is lower. On lower timeframes, consider using them mainly as a filter.
Two points create a line, but three touches (or more) typically make it meaningful (because the market has “respected” it multiple times).
Often, yes because they can behave like dynamic support/resistance. That said, in tight ranges, horizontal levels may be clearer than diagonal lines.
Because they lag price and tend to whip around when price lacks direction, creating frequent crossovers with low edge.
If you’re coding on MetaTrader 4, here are two simple examples: a manual SMA calculation and the built-in iMA version.
//+------------------------------------------------------------------+
double CalcSimpleMovingAverage(string symbol,int period,ENUM_TIMEFRAMES timeframe)
{
  double total=0;
  double prices[];
  ArrayCopySeries(prices,MODE_CLOSE,symbol,timeframe);

  for(int i=0;i<period;i++)
    total+=prices[i];

  return total/period;
}
//+------------------------------------------------------------------+
Using the built-in MT4 function:
double sma = iMA(Symbol(), PERIOD_CURRENT, 20, 0, MODE_SMA, PRICE_CLOSE, 0);
Moving averages and trend lines are two of the most useful tools in technical analysis (but they solve different problems).
If you want the most practical approach, combine both: use moving averages for trend bias and trend lines for entries, exits, and breakout validation, always backed by solid risk management.
Technical Analysis10 free MT5 indicators for trend, structure, momentum, correlation, sessions, and pivots, all free with no trial and no expiry.
 Technical Analysis
Multi-timeframe trading in MT5 — top-down analysis, the best timeframe combinations for every style, workflows, indicators, and common mistakes.
 Technical Analysis
Trendline PRO is the MT5 EA for discretionary trendline traders — automatic execution on breakouts, pullbacks, touches and false breakouts.