
 Technical Analysis
Best Forex Indicators for Scalping MT5
The best forex indicators for scalping MT5 — Bollinger Bands, EMAs, VWAP, ATR, ZigZag zones and more in a complete five-layer scalping system.
10 free MT5 indicators for trend, structure, momentum, correlation, sessions, and pivots, all free with no trial and no expiry.
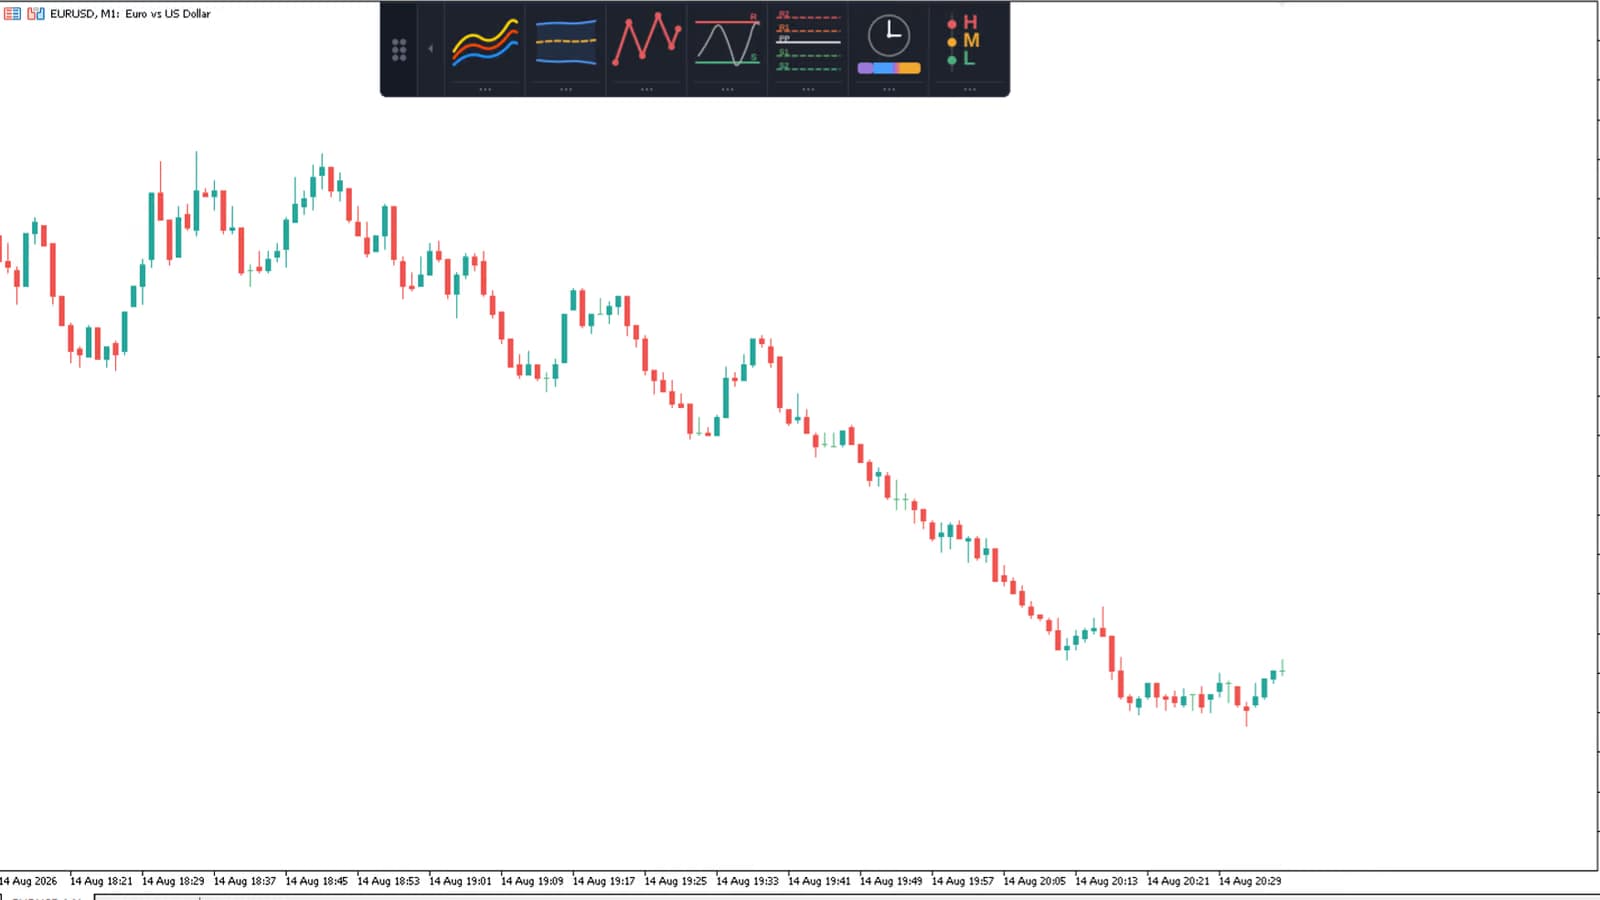
If you moved from MT4 to MetaTrader 5 and went looking for the best MT5 indicators, you probably noticed the ecosystem is smaller and messier than MT4's. A lot of what shows up under "MT5 indicators" is just an old MT4 port that repaints, leaks memory, or was never rebuilt for the native MT5 event model. This list isn't about the indicators already built into MT5, Moving Averages, MACD, RSI, and the rest ship with the platform. It's about the custom ones worth adding on top.
This guide is the MT5 companion to our MT4 indicators roundup. It's a top-10 shortlist of free MT5 indicators, all of them tools I've actually run on a chart, covering trend, order flow structure, momentum, correlation, sessions, and levels. Every one of the ten is free with no trial and no expiry.
About the author: Carlos Oliveira. I build trading tools for MetaTrader and run ForexTradingTools.eu. I focus on practical utilities and indicators that improve decision-making, chart clarity, and risk awareness.
This guide shortlists 10 free MT5 indicators for trend, momentum, order flow structure, correlation, sessions, and pivots, then shows how to install and combine them without turning your chart into wallpaper.
Ten free MT5 indicators, in the order I'd actually recommend trying them. Each entry gets a real on-chart screenshot, not a logo, so you can see what you're installing before you install it.
What it does: Plots a single ATR-based trend line that sits below price in an uptrend and above price in a downtrend, flipping sides whenever the trend reverses. An optional Show_Filling input shades the zone between price and the line.
It's the simplest trend filter on this list, and that's the point. Green line under price means uptrend bias, red line above means downtrend bias, and you don't need to think any harder than that on any timeframe.
Expert tip: Use it as a filter, not a signal. Like any ATR-based trailing line, it lags at the exact turning point by design, so don't take a SuperTrend flip as your entry trigger on its own.
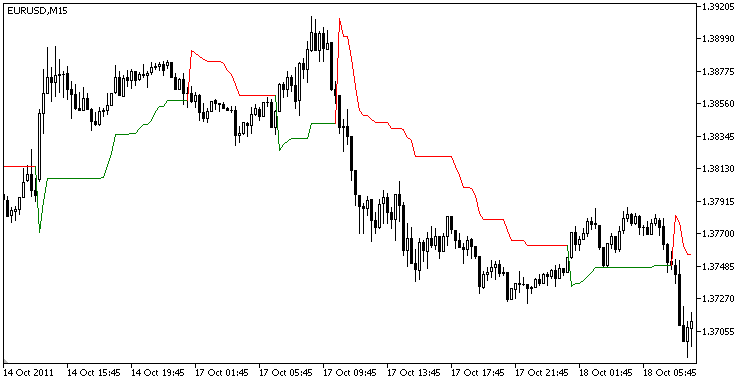
Free and open source, published by FxGeek on the official MQL5 CodeBase. 126,952 views, rated 107 at time of writing, one of the oldest and most reviewed indicators in this list.
⬇️ Download SuperTrend (MQL5 CodeBase)What it does: Draws a horizontal volume histogram between two vertical lines you place on the chart, showing exactly which prices had the most trading activity in that window. This is the point of control view traders on futures and prop desks have used for years.
It's best for finding where the market built up the heaviest volume inside a range on any timeframe, because heavy volume tends to act as support or resistance the next time price revisits it.
Expert tip: Set the calculation timeframe well below your chart's timeframe (M1 data on an H1 chart, say) for a more accurate profile. The default assumes volume spreads evenly across each candle, which understates activity right at the open and close.
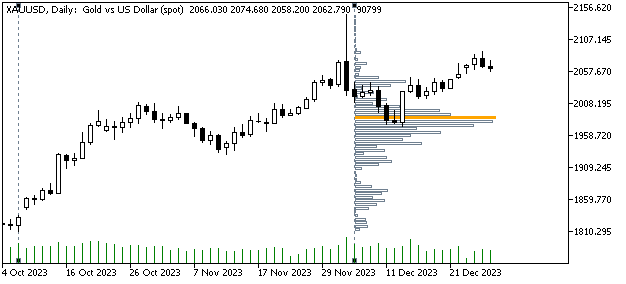
Free and open source, published by Mohammad Baset on the official MQL5 CodeBase. 69,212 views, rated 26.
⬇️ Download Volume Profile (MQL5 CodeBase)What it does: Brings the full smart money concepts (SMC) toolkit onto your chart automatically: market structure breaks (BOS/CHoCH), order blocks, fair value gaps, equal highs/equal lows, and buy/sell arrows. Every module toggles independently and the zones are ATR-adaptive.
It's the most complete package here for anyone trading structure and order flow, since it replaces manually marking order blocks and fair value gaps by hand on H1 or H4.
Expert tip: Order blocks and fair value gaps mark zones worth watching, not guaranteed reversal points. Wait for price to actually react at the zone before treating it as confirmation.

Free and open source, published by Hammad Dilber on the official MQL5 CodeBase. Newer than the others here, published April 2026, with 14,211 views so far.
⬇️ Download Smart Money Concepts (MQL5 CodeBase)What it does: Detects RSI divergence and plots it straight into indicator buffers instead of leaving you to eyeball the RSI line against price. It's a fork of Divergence DeMarker, and because it writes to buffers, an EA can read the signal too.
It's best for momentum-based reversal spotting on any timeframe, and it saves the tedious part: manually drawing trendlines on RSI to check whether price and momentum actually disagree.
Expert tip: Divergence is a warning, not a trigger. Wait for structure to confirm it, a broken trendline or a lower high, before you act on the signal alone.
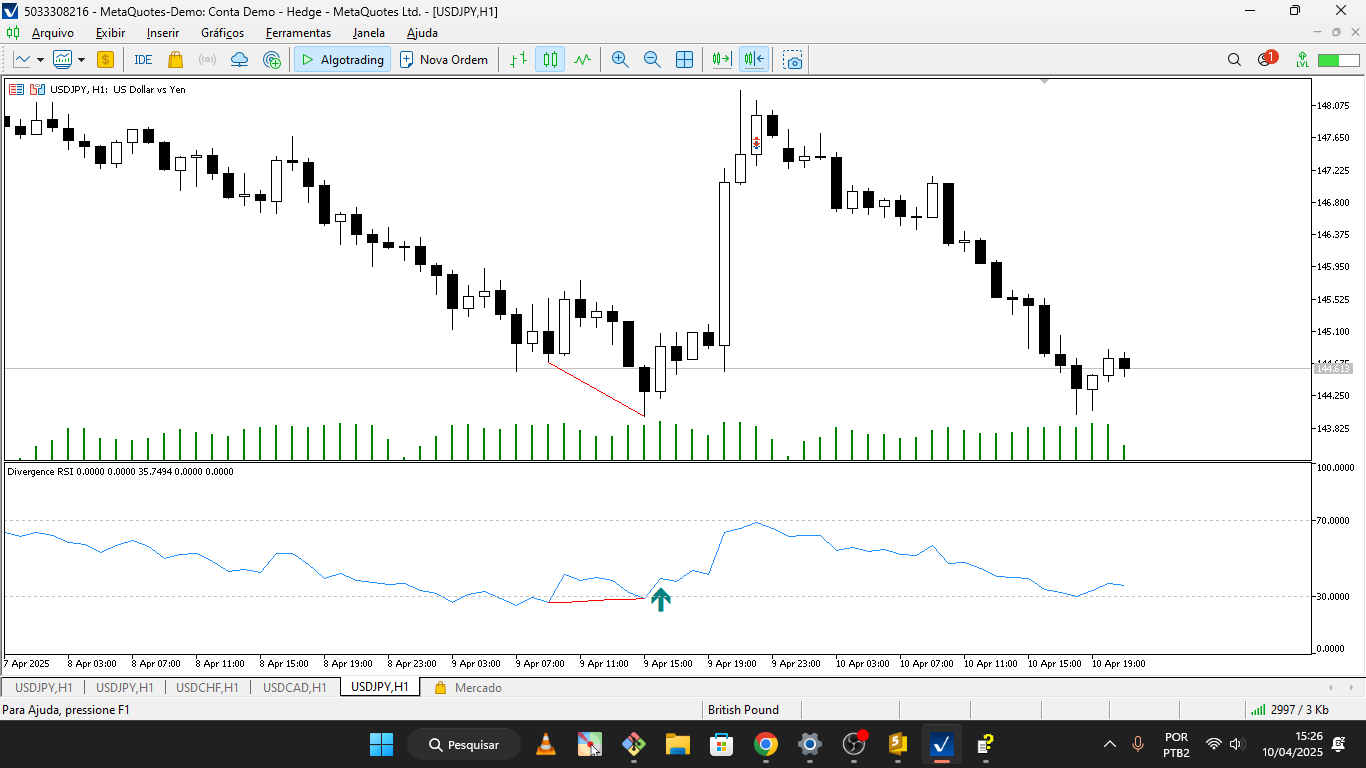
Free and open source, published by Francisco Gomes Da Silva on the official MQL5 CodeBase. 8,555 views, rated 3.
⬇️ Download RSI Divergence (MQL5 CodeBase)What it does: A draggable dashboard that heatmaps correlation across every symbol in your Market Watch, red for negative and blue for positive, with the exact Pearson coefficient behind each cell. Switch between D1, H4, H1, and M15 instantly.
It's account-level rather than tied to one chart, and it's best for catching the mistake most traders make without noticing: opening a second position that's really just the first trade again in a different symbol.
Expert tip: Check the matrix before you add a pair, not after. Two positions that move together are one trade at double the risk, not two separate ones.
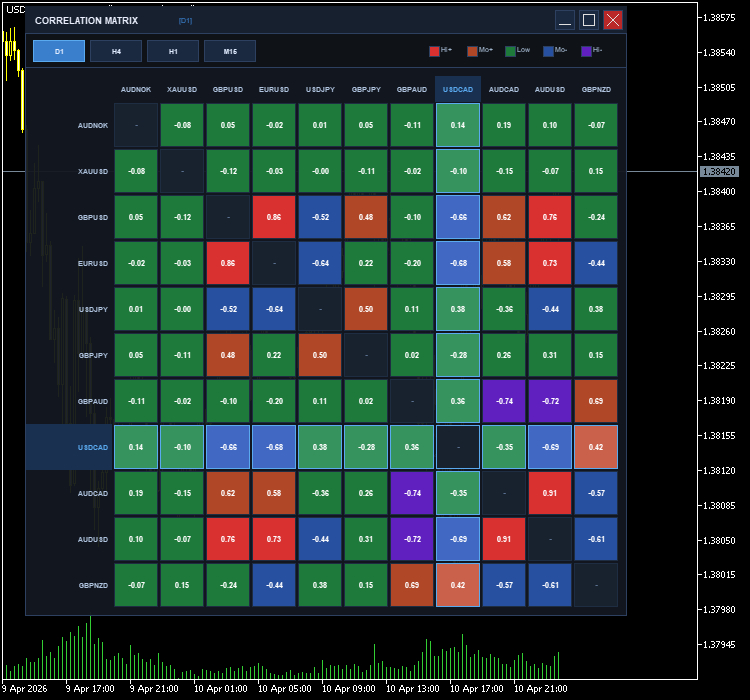
Free and open source, published by Kayode Michael Oyetunde on the official MQL5 CodeBase. 3,148 views, rated 2.
⬇️ Download Correlation Matrix Heatmap (MQL5 CodeBase)Also worth a look: Auto Fibonacci Indicator by Ahmed Soliman auto-draws Fibonacci retracement lines between the last major high and low, free on the CodeBase, handy if you trade Fib levels but don't want to redraw them every session.
Five more worth adding to your chart:
What it does: Plots a fast and a slow ZigZag line, then clusters the swing pivots into ATR-adaptive support and resistance zones instead of single lines, and keeps broken zones visible so you can see where structure actually failed.
It's best for swing structure, breakout and rejection trades, and Fibonacci anchors on M15-H4 charts. Clustered zones are more honest than a single hand-drawn line, because price rarely respects one exact price to the pip.
Expert tip: Watch the fast ZigZag inside a zone for early pivot confirmation, then use the slow ZigZag to confirm the swing actually held.
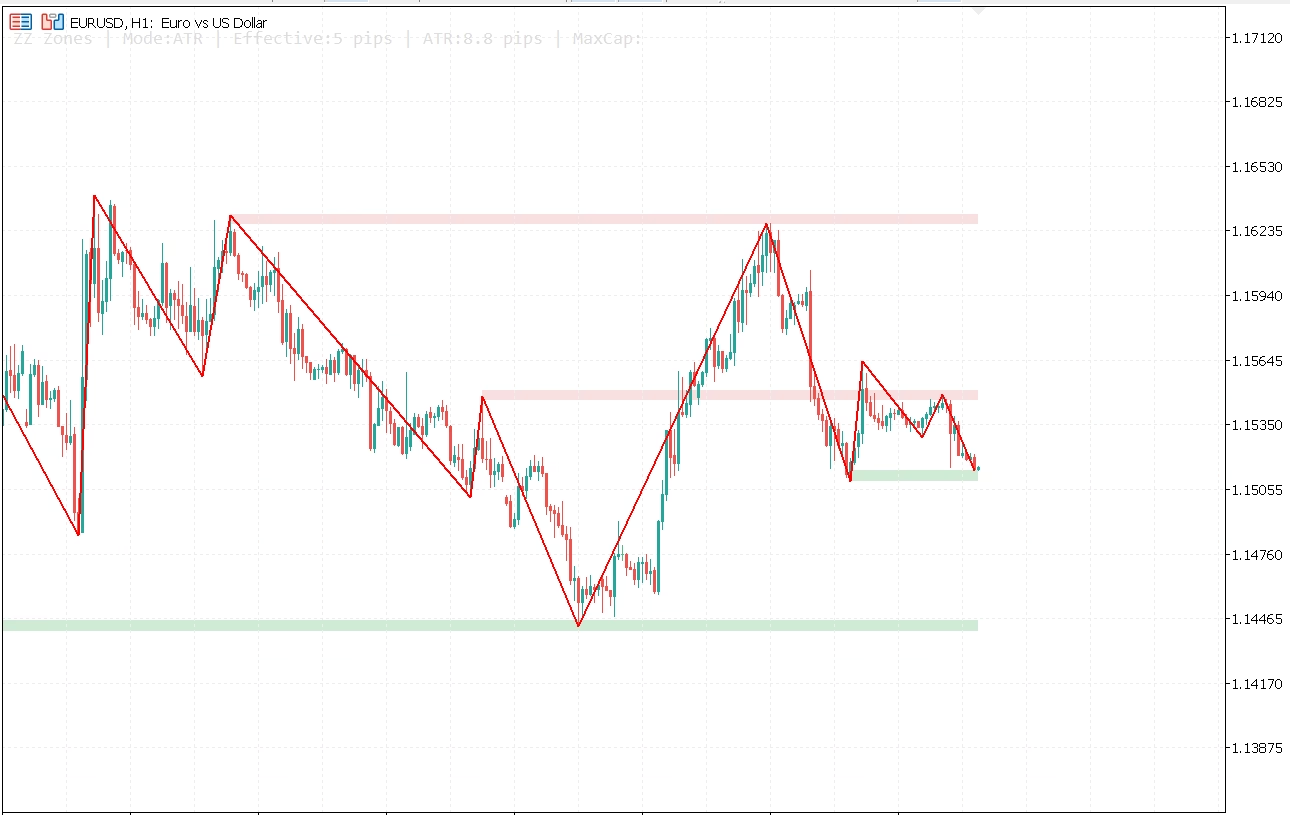
Paid alternative: Bundled into ChartDeck PRO and Multi-Indicator Panel MT5 if you want it alongside six other tools in one panel.
What it does: Color-codes the Asian, London, and New York sessions on your chart, plots each session's high and low going back up to 5 days, and shades session backgrounds so overlaps are obvious at a glance.
It's best for intraday structure, breakouts, and session range plays on M5-H1 charts. It's the direct, actively maintained successor to the old MT4 Session High Low indicator I linked in the MT4 post.
Expert tip: Treat the prior day's session highs and lows like intraday key levels, and combine with a price-action trigger instead of trading the level blind.
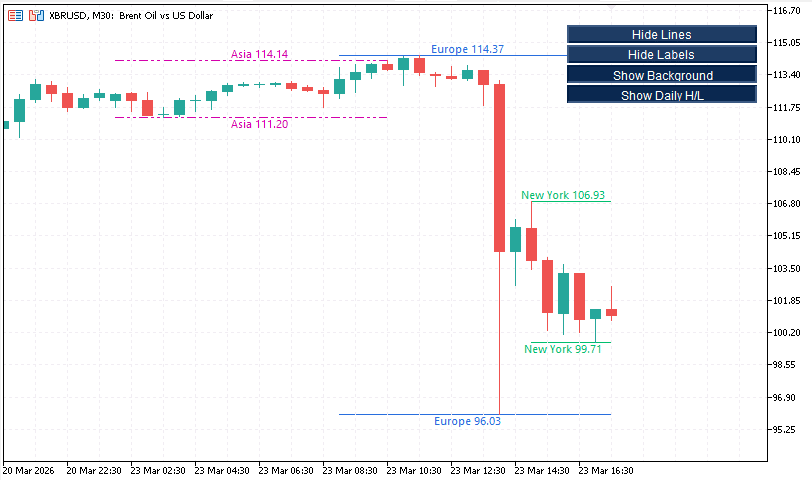
Paid alternative: Bundled into ChartDeck PRO and Multi-Indicator Panel MT5 as the sessions module.
What it does: Draws Classic, Fibonacci, Camarilla, Woodie, or DeMark pivot points on daily, weekly, or monthly bases, with up to 50 historical periods and the full R1-R4/S1-S4 spread.
It's best for daily support and resistance and session-based trade ideas on M15-H1 charts. Pivots give you levels the whole market is watching, which is exactly what makes them useful for targets and stop placement.
Expert tip: Start with Classic pivots on the daily basis. Add a second method only if you're trading a strategy actually built around it, Camarilla for range reversals is the common one.
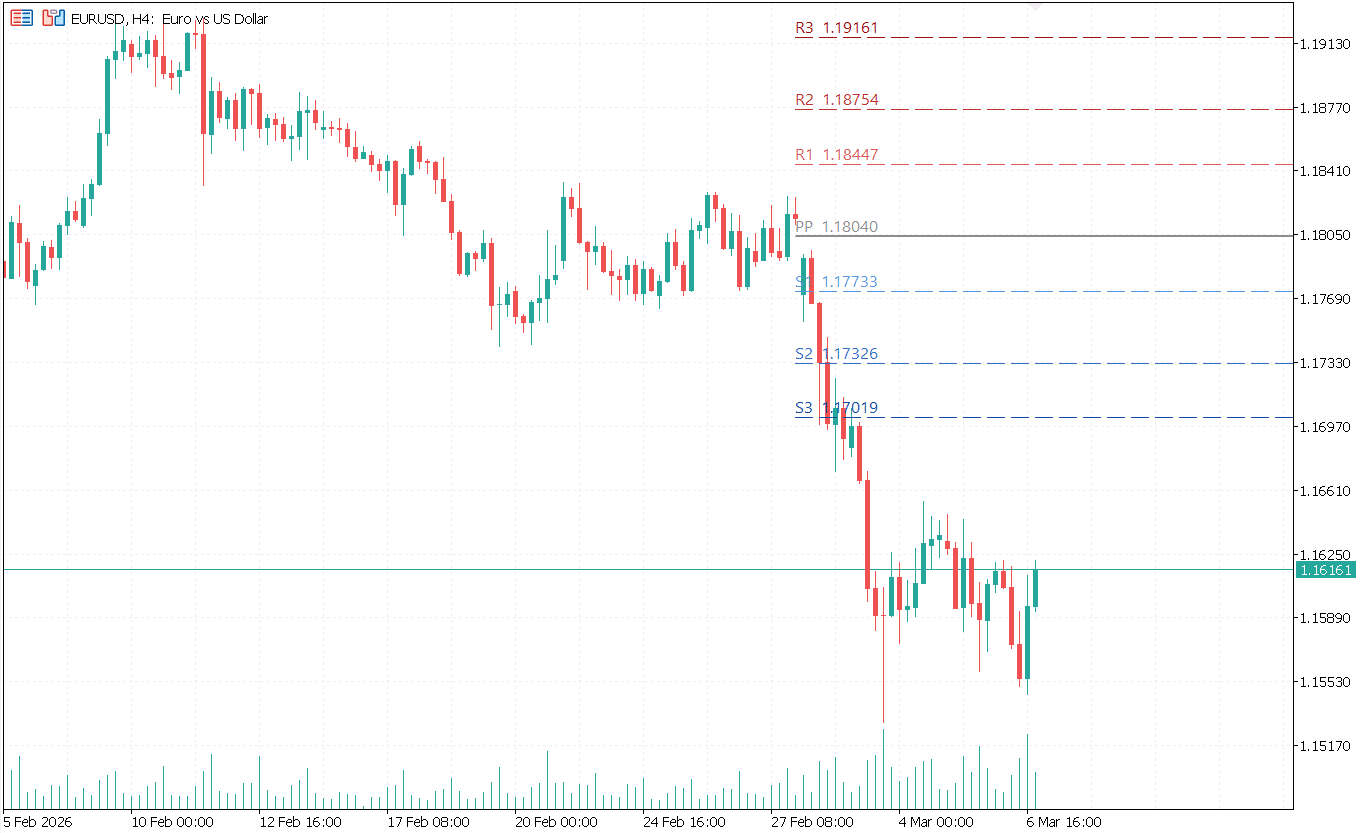
Paid alternative: Bundled into ChartDeck PRO and Multi-Indicator Panel MT5 as the pivot points module.
What it does: Displays Bollinger Bands from up to 9 timeframes (M1-MN1) on one chart, in a draggable, one-click toggle panel, without repainting closed values.
It's best for confluence and higher-timeframe confirmation. Trade M5-H1 with H1-D1 bands layered on top, since a lower-timeframe signal is stronger when it agrees with higher-timeframe structure.
Expert tip: If price is stretched at the higher-timeframe outer band, be cautious chasing a lower-timeframe breakout in the same direction. That's usually the move that runs out of room first.
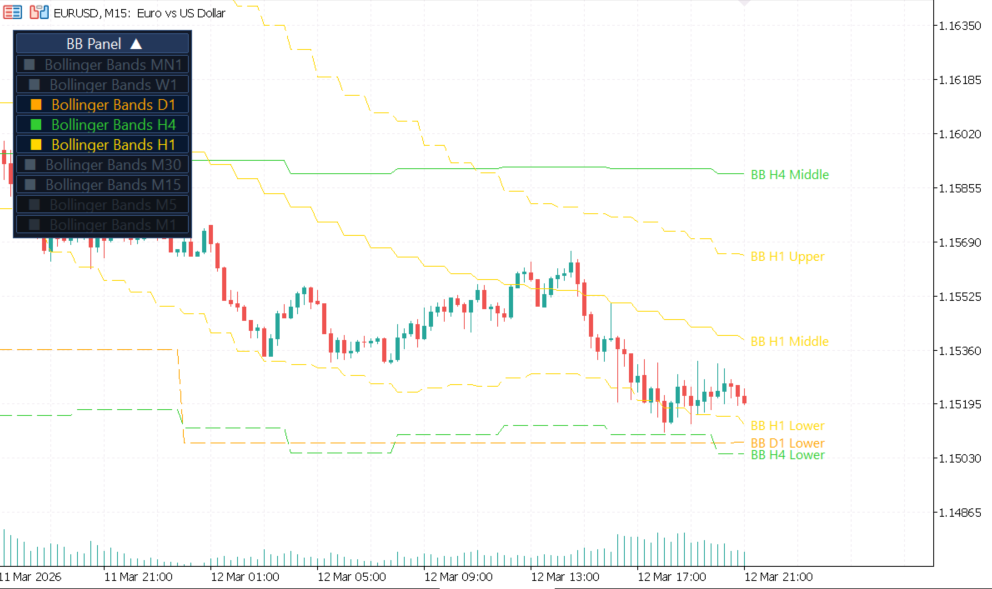
Paid alternative: Bundled into ChartDeck PRO and Multi-Indicator Panel MT5 as the Bollinger Bands module.
What it does: Shows upcoming and recent high, medium, and low-impact economic events directly on your chart, with impact colors, currency filtering, and vertical event lines, pulled from MT5's own calendar with no external feed to configure.
It's best for avoiding trades right before high-impact news and for planning session risk on M1-H1 charts. Spreads widen and stops get skipped around major releases, so seeing the event coming matters more than reacting to the spike after it hits.
Expert tip: If you're not a news trader, don't open new trades 5-15 minutes before CPI, NFP, or a rate decision. Existing positions still need a plan either way.
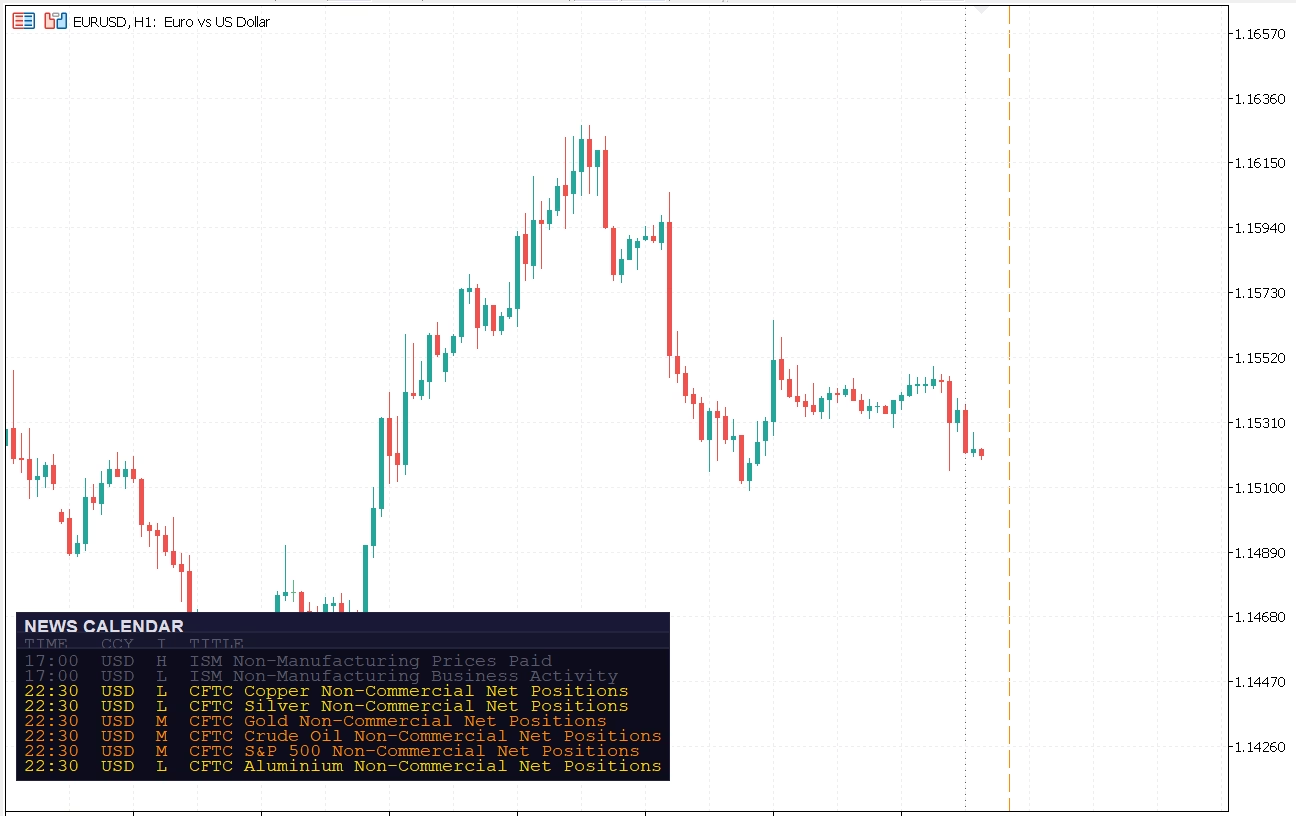
Paid alternative: Bundled into ChartDeck PRO and Multi-Indicator Panel MT5 as the daily news module.
Beyond indicators: if you draw trendlines to plan entries by hand, Trendline PRO turns a drawn line into a rule-based order with breakout and pullback triggers, TP/SL zones, and auto-breakeven or trailing, for MT4 and MT5.
Most "indicator doesn't work" problems come from installing it in the wrong folder. Here's the simplest correct method for MT5:
.mq5 file directly..ex5 file (or the .mq5 source, then compile it in MetaEditor) into that Indicators folder.Troubleshooting: if it still doesn't appear, confirm it's in Data Folder → MQL5 → Indicators, not the Program Files folder, and check the Experts and Journal tabs for a blocked DLL or a failed compile.
The goal isn't more indicators. The goal is clear confirmation, with each tool doing a different job.
Pivot Points (2.8) mark the levels the market is watching, Session High Low (2.7) adds intraday range, and SuperTrend (2.1) confirms you're trading with the trend, not against it.
ZigZag Zones (2.6) supplies swing-based zones, MTF Bollinger Bands (2.9) adds higher-timeframe volatility boundaries, and RSI Divergence (2.4) flags when momentum disagrees with price right at one of those zones. When all three line up, it's a much stronger setup than any one alone.
Before you open a second position, check Correlation Matrix Heatmap (2.5). If it's highly correlated with something you're already holding, you don't have two trades, you have one trade at double size. News Calendar MT5 (2.10) covers the other half: know when an event is about to move both pairs at once.
Shortcut: the tools in combos A and B, Pivot Points + Session High Low, and ZigZag Zones + MTF Bollinger Bands, are exactly what ChartDeck PRO docks into one panel. If you land on running 4 or more of these together, it's worth pricing out the panel against running them separately.
Here's the full shortlist again in one table: what each indicator is for, its best timeframe, and where it comes from.
| Indicator | Best For | Best Timeframe | Source |
|---|---|---|---|
| SuperTrend | Simple visual trend filter, ATR-based flip line | Any | MQL5 CodeBase (free) |
| Volume Profile | Point of control, where volume actually traded in a range | Any | MQL5 CodeBase (free) |
| Smart Money Concepts | Order blocks, fair value gaps, market structure breaks | H1-H4 | MQL5 CodeBase (free) |
| RSI Divergence | Automated momentum divergence detection | Any | MQL5 CodeBase (free) |
| Correlation Matrix Heatmap | Spotting duplicated risk across correlated pairs | D1-M15 (account-level) | MQL5 CodeBase (free) |
| ZigZag Zones MT5 | Swing structure, breakout/rejection zones, Fibonacci anchors | M15-H4 | Supported product (free) |
| Session High Low MT5 | Intraday structure, breakouts, session range plays | M5-H1 | Supported product (free) |
| Pivot Points MT5 | Daily/weekly/monthly S/R, session-based trade ideas | M15-H1 | Supported product (free) |
| MTF Bollinger Bands MT5 | Confluence, volatility context, higher-timeframe confirmation | M5-H1 (HTF bands: H1-D1) | Supported product (free) |
| News Calendar MT5 | Avoiding trades before high-impact news, session risk | M1-H1 | Supported product (free) |
Tip: don't run all 10 at once. Pick 2-3 that match your trading style, then add another only if it's actually solving a problem you have.
MT5 (MetaTrader 5) is MetaQuotes' newer trading platform for Forex, CFDs, and futures. It's not backward-compatible with MT4: .ex4 files won't run in MT5, and vice versa, which is why "MT4 indicators" need a native MT5 rebuild, not just a copy-paste.
No. Indicators visualize information and improve decision-making, but they don't replace risk management, execution discipline, or a tested trading plan.
Yes, all 10. The 5 CodeBase picks (2.1-2.5) are community-published, open-source .mq5 files: free to use, no support line attached if something breaks. The other 5 (2.6-2.10) are free with no trading restrictions and no expiry, and come with a supported product page. If you later want a paid upgrade, ChartDeck PRO, Multi-Indicator Panel MT5, or Equity Tracker MT5, that's a separate, optional purchase, not a requirement to use anything on this list.
No. Start with 2-3 that solve your biggest problem, levels, trend, or risk. If you find yourself wanting 4 or more of these running together, ChartDeck PRO consolidates seven of them into one panel.
For most beginners: Session High Low (2.7), Pivot Points (2.8), and SuperTrend (2.1). Structure, levels, and a trend filter, without turning your chart into noise.
Session High Low (2.7) and Pivot Points (2.8) for structure, plus News Calendar (2.10) as a news filter.
If it appears in Navigator → Indicators, it's installed. If it doesn't show up, re-check the folder path (Data Folder → MQL5 → Indicators) and restart MT5.
The best free MT5 indicators don't predict the market. They help you see what matters faster: structure, trend, momentum, correlated risk, sessions, and levels. The edge still comes from combining a few tools with disciplined execution, not from running all ten.
Next step (simple 2-week challenge): pick one setup:
Outgrew running four or more of these separately? Get ChartDeck PRO → and dock seven of them in one panel. Want your account watched around the clock instead? Equity Tracker MT5 sends real-time Telegram and Discord alerts on every trade and every drawdown breach.
Technical AnalysisThe best forex indicators for scalping MT5 — Bollinger Bands, EMAs, VWAP, ATR, ZigZag zones and more in a complete five-layer scalping system.
 Technical Analysis
How to trade pivot points on MT5 — bounce trading, breakouts, and confluence strategies, plus a free pivot points indicator to get started.
 Technical Analysis
The best MT4 indicators for spotting trends, timing entries, and managing risk — a top-10 toolkit every MetaTrader 4 trader should know.