
 Technical Analysis
10 Best Free MT5 Indicators (2026)
10 free MT5 indicators for trend, structure, momentum, correlation, sessions, and pivots, all free with no trial and no expiry.
Trendlines are among the simplest tools in technical analysis — and the most misused. Learn 7 rules for drawing and trading them consistently.

Trendlines are one of the simplest tools in technical analysis, and also one of the most misused. Many traders draw them inconsistently, trade them emotionally, or abandon them after a few losing trades. The problem is not trendlines themselves, but how they are drawn, interpreted, and traded. If you clicked on this article, chances are you want to understand how to trade using trendlines correctly, avoid common mistakes, and apply them with confidence in real market conditions. This guide focuses on how to trade using trendlines in a structured, rule-based way that removes guesswork and emotional decisions. By the end of this guide, you’ll know:
Table of Contents
In trading, a trendline is a diagonal support or resistance zone created by connecting a sequence of higher lows in an uptrend or lower highs in a downtrend.
Trendlines are not fixed levels. They evolve over time and should always be interpreted as areas of interest, not exact prices. Trendlines are widely used in technical analysis and are documented in classic trading literature and references such as Investopedia’s trendline definition.
Trendlines do more than show direction. They help traders:
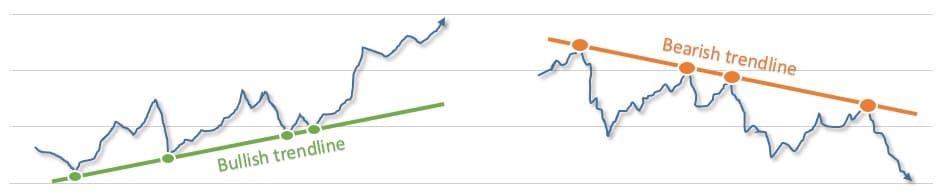
The slope of a trendline reflects the speed at which price moves relative to time, not momentum alone. Very steep trendlines often signal aggressive moves that are unsustainable and prone to sharp corrections. Shallow, steady slopes tend to be more durable and tradable.
More touches mean more traders see the line, but late-stage trendlines often fail as liquidity builds for a breakout.
Draw the trendline along higher lows.
Draw the trendline along lower highs.
A common beginner mistake is treating trendlines as precise levels. In reality, price often:
Because time moves forward, the exact price of a trendline constantly changes. Precision entries are unrealistic. Zones matter more than lines.
When a trendline breaks decisively, it may later act as support or resistance from the opposite side. This behavior often confirms its importance, especially when aligned with higher-timeframe structure.
Every trendline trade boils down to one question:
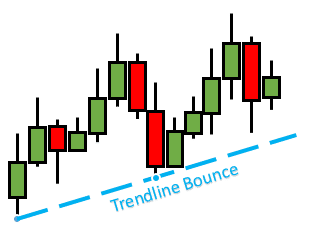
Will price bounce or break?
This decision must always be made in context: trend strength, volatility, nearby structure, and higher-timeframe bias matter more than the trendline itself. If you are serious about learning how to trade using trendlines, you must decide in advance whether you are trading bounces, breakouts, or standing aside.
Bounce Rules (practical template)
Entry: Near the trendline using a volatility-adjusted distance (≈ 0.1-0.3 ATR)
Stop-loss: Beyond the trendline plus buffer (≈ 0.2-0.5 ATR)
Take-profit: Prior swing or minimum 1:2 risk-to-reward
A breakout is valid only when price accepts beyond the trendline. Signs of acceptance include:
In spot FX, confirmation comes from price behavior and structure, not volume alone.
If you combine trendlines with proper risk control, tools like the Equity Tracker MT5 can help you monitor drawdown in real time. You may also want to read our guide on price action trading tools to complement trendline analysis.
Two define it. Three or more increase visibility, not certainty.
If price accelerates rapidly, expect instability or correction.
Yes, but higher-timeframe trendlines always dominate lower ones.
Trendlines are not magical tools. They don’t predict the future. They organize price behavior. When used consistently, in context, and combined with solid risk management, they become one of the most effective ways to trade market structure.
Master the process, not the line.
Technical Analysis10 free MT5 indicators for trend, structure, momentum, correlation, sessions, and pivots, all free with no trial and no expiry.
 Technical Analysis
Multi-timeframe trading in MT5 — top-down analysis, the best timeframe combinations for every style, workflows, indicators, and common mistakes.
 Technical Analysis
Trendline PRO is the MT5 EA for discretionary trendline traders — automatic execution on breakouts, pullbacks, touches and false breakouts.