
 Technical Analysis
Best Forex Indicators for Scalping MT5
The best forex indicators for scalping MT5 — Bollinger Bands, EMAs, VWAP, ATR, ZigZag zones and more in a complete five-layer scalping system.
How to trade Bollinger Bands in MT5 — entry and exit rules, stop-loss placement, and multi-timeframe techniques used by professional traders.
Bollinger Bands are one of the most widely used volatility indicators in trading, and one of the most misused. When applied correctly in MetaTrader 5 (MT5), they give you a precise read on market volatility, dynamic support and resistance, and high-probability trade setups across any timeframe or instrument. In this guide you will learn:
Bollinger Bands are a volatility indicator developed by technical analyst John Bollinger in the early 1980s and published in his 2001 book Bollinger on Bollinger Bands. They are now considered a standard tool in technical analysis and are included natively in MT5.
You can read John Bollinger's own methodology at BollingerBands.com. The indicator consists of three lines plotted directly on your price chart:
The 2 standard deviation setting is not arbitrary. In a normal distribution, approximately 95% of all price data falls within 2 standard deviations of the mean. This is the statistical basis of the indicator: when price moves outside the bands, it is doing something statistically unusual, and the market tends to respond. The concept of standard deviation and its application to financial markets is well documented by Investopedia's Bollinger Bands reference. As volatility rises, the bands widen to contain the expanded price range. As volatility contracts, the bands narrow. This dynamic expansion and contraction is what makes Bollinger Bands so useful for identifying:
Beyond the three bands themselves, two derived measurements are worth knowing:
MT5 includes Bollinger Bands as a built-in indicator. To add them to your chart:
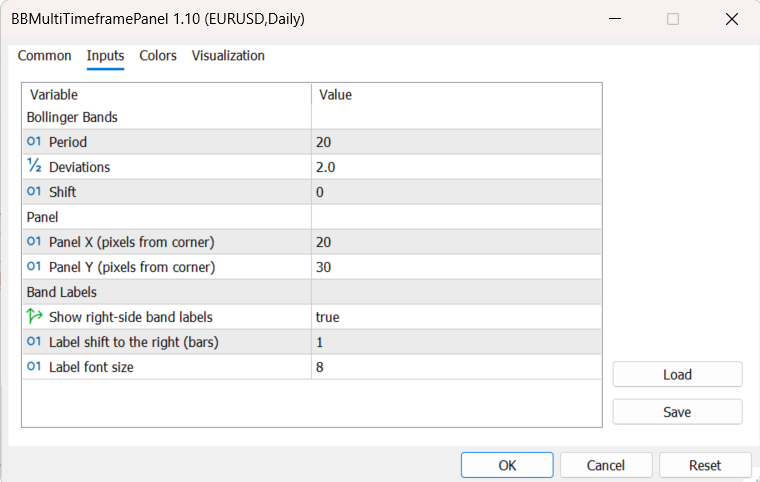
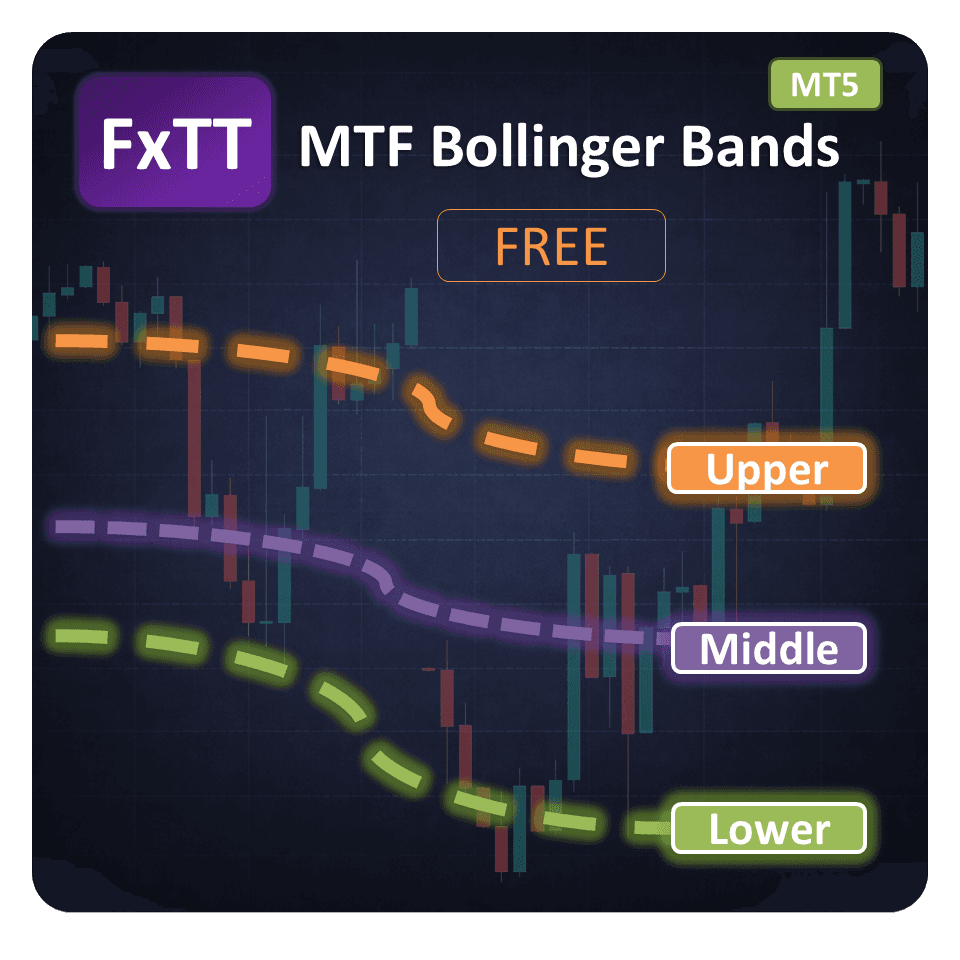
Note on Deviation: For more volatile pairs such as GBP/JPY or XAU/USD, increasing the deviation to 2.5 prevents excessive false signals from normal price noise. For calmer pairs like EUR/CHF, the standard 2.0 works well. What the Shift parameter does: Shift displaces the bands forward or backward in time. Leave this at 0 for standard use; only advanced traders with specific overlay strategies adjust this. If you want to go beyond the single built-in indicator and plot Bollinger Bands from multiple timeframes on a single chart, our MTF Bollinger Bands for MT5 indicator does exactly that, displaying up to nine timeframes simultaneously so you never miss higher-timeframe context.
This guide covers three field-tested Bollinger Bands strategies for MT5: mean reversion in ranging markets, squeeze breakouts, and trend trading. Each includes exact entry, stop-loss, and take-profit rules you can apply directly on your chart.
The core idea: in a ranging market, price tends to revert toward the moving average after extending too far from it. A band touch alone is not a signal; you need confirmation that the move is exhausted. According to Investopedia's Bollinger Bands guide, mean reversion strategies can work well in range-bound markets: exactly the conditions where Bollinger Bands contract and price oscillates between the outer bands. Best conditions: Low to moderate volatility, no major news pending, pair trading sideways on higher timeframe.
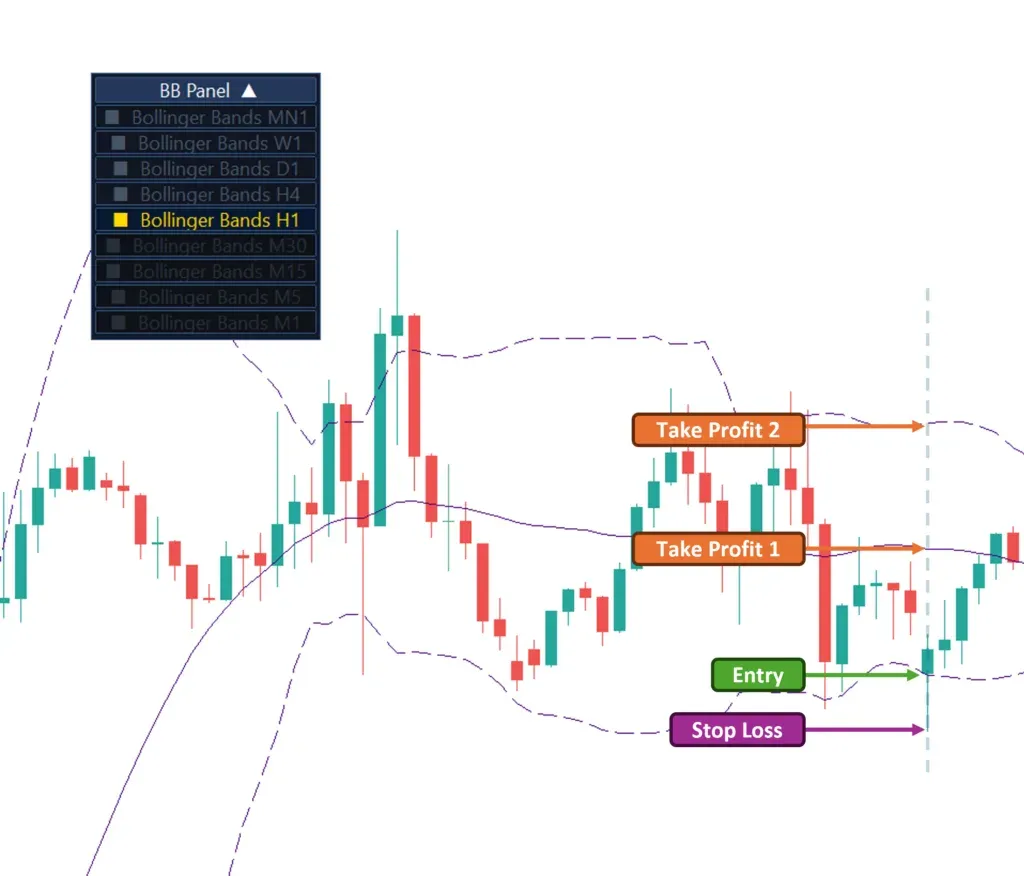
⚠ Critical rule: Do NOT use mean reversion in a trending market. In a strong uptrend, price can walk the upper band for many candles. Always check the higher timeframe before fading a band touch. To make sure you never skip your confirmation checklist in the heat of a trade, our free Strategy Checklist indicator lets you define a custom checklist that appears directly on your MT5 chart, helping you enforce discipline on every entry.
When the bands contract to unusually narrow levels, the market is coiling energy. This is called the Bollinger Squeeze. A breakout from this compression is often the beginning of a significant directional move. The squeeze is one of the most studied patterns in technical analysis; Investopedia's Bollinger Squeeze guide explains the setup in detail. Best conditions: Following a prolonged period of low volatility (watch bandwidth narrowing over 10-20 candles). Most powerful on H1 and H4 timeframes.
⚠ False breakout filter: If the breakout candle closes back inside the bands on the same session, treat it as a false break and stand aside. Wait for a new squeeze to develop. For breakout trades triggered by trendline breaks alongside a Bollinger squeeze, our Trendline EA can automate entry and management once a trendline is breached, removing the emotional hesitation that often causes traders to miss the initial breakout candle.
In a strong trend, price doesn't reverse from the bands; it rides them. This is one of the most consistently profitable Bollinger Band applications and the one most retail traders miss because they're always trying to fade moves. Best conditions: Clear higher-timeframe trend, price consistently closing above/below the middle band.
The same logic applies in reverse for short trend setups. The key shift in thinking: in a trend, the middle band is support/resistance, not the outer bands. To confirm the higher-timeframe trend direction quickly, our free MTF Triple Moving Averages indicator overlays moving averages from multiple timeframes onto a single chart, giving you an immediate read on whether the trend is aligned across timeframes before you enter.
Bollinger Bands are most powerful when combined with other indicators from our full list of the best MT4 indicators. Here are the highest-value pairings:
RSI (14) adds a momentum reading to confirm what the bands are showing. The most powerful combination: price touches the lower band while RSI shows divergence (price makes a lower low, RSI makes a higher low). This confluence dramatically increases the probability of a successful mean reversion trade. The RSI indicator was developed by J. Welles Wilder and documented in his 1978 book New Concepts in Technical Trading Systems; its methodology is well explained by Investopedia's RSI guide.
Volume is particularly important for breakout trading. A squeeze breakout with 2x average volume behind it is far more reliable than one occurring on thin volume. In MT5, add the Volume indicator (Insert → Indicators → Volumes → Volumes) and look for the volume spike to align with your breakout candle.
When the lower or upper band aligns with a major support/resistance level, previous high/low, or a round number, the probability of a reaction at that level increases significantly. Always mark out key horizontal levels before relying on a band touch alone. Our free FXTT Pivot Points indicator automatically plots key price-based reference levels on your MT5 chart, making it easy to spot when a Bollinger Band touch coincides with a major pivot level.
Rather than waiting for setups to appear on a single chart, you can scan multiple pairs simultaneously for Bollinger Band conditions. Our free Multi-purpose Forex Scanner monitors multiple instruments at once, saving you the time of flipping through charts manually to find the best setups.
The standard MT5 Bollinger Bands indicator only shows one timeframe at a time, creating a blind spot: a band touch on the H1 chart can be insignificant once the H4 chart shows price sitting mid-band with plenty of room to run.
Multi-timeframe analysis solves this. When the H4 and H1 both show price at the lower band simultaneously, the confluence of two timeframes pointing to the same zone is a much stronger signal than a single timeframe reading alone. This principle is widely endorsed by institutional technical analysts; TradingView's community research consistently shows multi-timeframe confluence as one of the top filters for improving signal quality. The MTF Bollinger Bands MT5 indicator overlays bands from up to nine timeframes directly onto a single chart. Instead of guessing whether a band touch is significant, you can see at a glance whether higher timeframes confirm the signal, giving you the context that separates high-probability trades from marginal ones. If you prefer a free starting point, the MTF Bollinger Bands Free indicator provides the same multi-timeframe overlay concept with core functionality at no cost.
Applying any strategy consistently is only half the battle: you also need to track whether it's working. Equity drawdowns, win rates, and risk-adjusted returns all tell you whether your Bollinger Band approach is actually profitable over time, not just in isolated trades.
The Equity Tracker MT5 monitors your account equity and balance in real time and sends alerts directly to Telegram or Discord when drawdown thresholds are breached, helping you spot when a strategy is underperforming before losses become significant.
Knowing when to stand aside is just as important as knowing when to trade. Bollinger Bands perform poorly in the following conditions:
Most Bollinger Bands losses come from a handful of repeatable errors. Here are the five mistakes that account for most of them, and how to avoid each one.
This is the most common and costly mistake. In a trending market, price can touch or walk along the outer band for 10, 20, or more candles. A band touch is only a potential reversal signal in a clearly ranging market with confirmation from a reversal candle and a momentum indicator like RSI. Without these filters, you'll be repeatedly stopped out fighting a strong trend.
A perfect-looking setup on the M15 is meaningless if the H4 chart is in a strong downtrend. Always establish the higher timeframe bias before entering any trade. Signals that align with the higher timeframe direction have statistically better outcomes.
Entering a trade because "price is at the lower band" without a defined stop-loss level is guessing, not trading. Every Bollinger Bands trade must have a pre-defined invalidation point. The Bank for International Settlements has documented that retail traders who do not use pre-defined stop-losses account for a disproportionate share of large account losses. If the setup fails, your loss should be small and defined before you enter.
Single-timeframe traders miss the full picture. A band squeeze on the H1 that is also visible on the H4 is a significantly stronger signal than one appearing on H1 alone. Build multi-timeframe context into every analysis.
Entering a breakout trade three or four candles after the initial break means you've already missed most of the move and are now entering at the point of maximum risk. Wait for either the initial breakout candle close, or a retest of the breakout level, for a better entry.
Yes. Bollinger Bands were originally designed with financial markets in mind and work well on forex pairs, particularly on H1 and above timeframes where price action is less noisy. They are most effective on major pairs like EUR/USD, GBP/USD, and USD/JPY.
For day traders, H1 provides the best balance of signal quality and frequency. Swing traders typically use H4 or Daily. Scalpers can use M5 or M15, but should expect more false signals and require tighter confirmation criteria.
They can identify conditions that commonly precede breakouts (specifically the Bollinger Squeeze pattern), but they cannot predict the direction of the breakout. You must wait for the breakout candle to confirm direction before entering.
RSI (14) is the most widely used complement to Bollinger Bands. Volume indicators help confirm breakout validity. For trend context, a higher-timeframe moving average or ADX (Average Directional Index) adds valuable information. Our MTF Triple Moving Averages indicator is a free option for adding multi-timeframe moving average context directly in MT5.
The 20-period default works well for most traders on most timeframes. The main reason to change it is trading style: scalpers benefit from a shorter period (10-15) for faster response; position traders may prefer 50 for smoother signals. Avoid over-optimizing; pick a setting and stick to it consistently.
Technical AnalysisThe best forex indicators for scalping MT5 — Bollinger Bands, EMAs, VWAP, ATR, ZigZag zones and more in a complete five-layer scalping system.
 Technical Analysis
10 free MT5 indicators for trend, structure, momentum, correlation, sessions, and pivots, all free with no trial and no expiry.
 Technical Analysis
Multi-timeframe trading in MT5 — top-down analysis, the best timeframe combinations for every style, workflows, indicators, and common mistakes.